Hospitalisations and deaths trends over 10 years
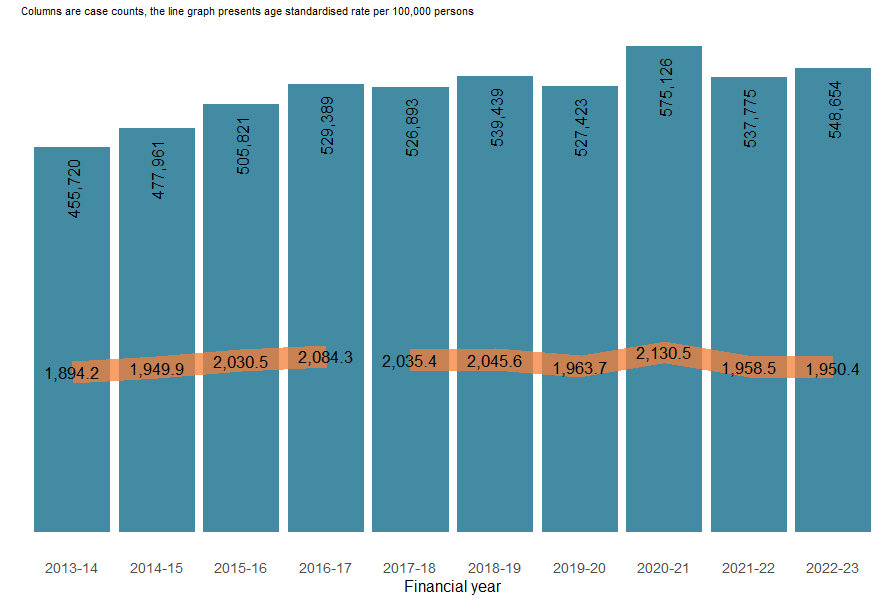
Between 2021–22 and 2022–23, the age-standardised rate of injury hospitalisations remained relatively stable. From 2017–18 to 2022–23 the age-standardised rate of injury hospitalisations fell by an annual average of 0.7%. The noticeable fluctuation in hospitalisation cases seen between 2020 and 2022 is possibly related to disruptions caused by COVID-19 (Figure 3).
Over the past decade, the likelihood of being hospitalised with an injury has remained relatively stable, with ASRs ranging from about 1,900 to 2,100 per 100,000 persons in the last decade. During the same period, the number of injury hospitalisations rose from about 456,000 to 549,000.
Figure 3: Numbers and age-standardised rates (per 100,000) of hospitalisations by financial years 2013–14 to 2022–23, Australia
Notes:
- Numbers and age-standardised rates of hospitalisations are represented in columns and as a line graph by financial years. Columns are case counts, while the line graph represents age-standardised rates per 100,000.
- Break in series between 2016–2017 and 2017–18. See technical notes for detail.
Sources: AIHW National Hospital Morbidity Database and ABS National, state and territory population.
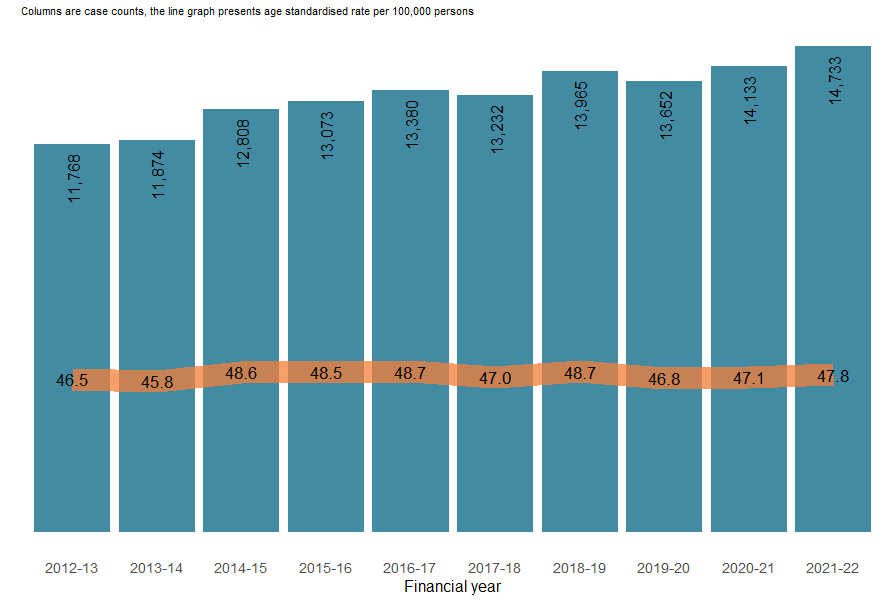
Over the past decade, the likelihood of dying from an injury has remained relatively stable, with age-standardised rates ranging from about 47 per 100,000 persons in 2012-13 to about 48 in 2021-22. During the same period the number of injury deaths rose from about 12,000 to 15,000.
Between 2012–13 and 2021–22, there was an average annual increase in the rate of 0.4% (Figure 4).
Figure 4: Numbers and age-standardised rates (per 100,000) of injury deaths by financial years 2012–13 to 2021–22, Australia
Notes:
- Numbers and age-standardised rates of injury hospitalisations are represented in columns by financial years. Columns are case counts of injury, while the line graph represents age-standardised rates of injury per 100,000.
Sources: AIHW National Mortality Database and ABS National, state and territory population.
For more detail, see supplementary data tables H9 and D3.