The main causes of injury
This chapter provides an overview of the main causes of injury hospitalisations (Figure 1) and deaths (Figure 2). Injuries have been categorised based on the first external cause of injury listed in each hospital and death record. ED presentations are not reported by cause due to the quality of this information currently recorded in ED presentations. Please refer to the technical notes for further details.
The frequency of injuries by cause remained stable since the last financial year of reporting. Falls remain the leading cause of injury for both hospitalisations and deaths with around:
- 238,000 hospitalisations or an age-standardised rate (ASR) of 760 per 100,000 persons) (Figure 1)
- 6,400 deaths or ASR of 17 per 100,000 persons) (Figure 2).
For hospitalisations, falls was followed by contact with objects (around 78,700 cases or 300 per 100,000) and transport (61,200 cases or 235 per 100,000). For deaths in 2021–22, suicide was the second highest cause (3,100 deaths or 12 per 100,000) followed by accidental poisoning (1,500 deaths or 5.9 per 100,000).
Figure 1: Number and age-standardised rate (per 100,000) of injury hospitalisations by cause of injury, Australia, 2022–23
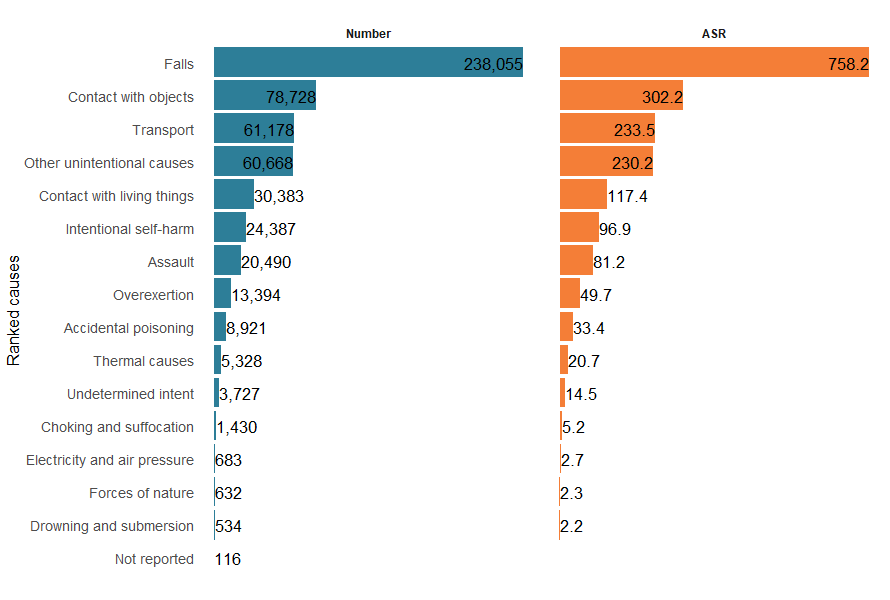
Notes:
- Numbers and age-standardised rates of hospitalisations are represented by ranked rows.
- Age-standardised rates are per 100,000 population.
Sources: AIHW National Hospital Morbidity Database and ABS National, state and territory population.
Figure 2: Number and age-standardised rate (per 100,000) of injury deaths by cause of injury, Australia, 2021–22
![Figure 2 shows the ranked number and ASR of injury deaths by cause. The top two causes for both numbers and ASR were falls followed by suicide.]](/getmedia/95b8622f-6567-4530-bc7e-dd888f55d45c/AIHW-INJCAT213-F2DeathCauseRank.png)
Notes:
- Numbers and age-standardised rates of deaths are represented by ranked rows.
- Age-standardised rates per 100,000 population.
Sources: AIHW National Mortality Database and ABS National, state and territory population.
For more detail, see supplementary data tables H1, H9, D1 and D3.