First Nations people
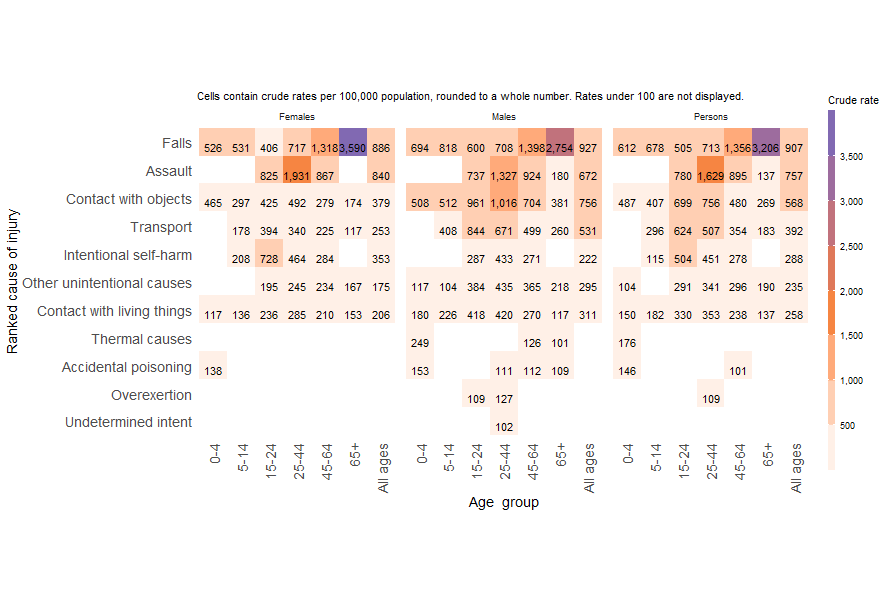
Falls, assault and contact with objects (around 910,760 and 570 cases per 100,000, respectively), were the three most common causes of injury that led to hospitalisations among First Nations people. Falls were the commonest cause of injury for both First Nations males and females (around 930 and 890 cases per 100,000, respectively) with the likelihood of a falls-related hospitalisation increasing with age (Figure 11).
Figure 11: Ranked causes of injury hospitalisations by age and sex among First Nations people, Australia, 2022–23
Notes:
- Density map of crude rates of hospitalisation cases of injury by cause, age and sex.
- Crude rates per 100,000 population rounded to a whole number.
- Rates under 100 are not displayed.
- All external causes of injury are not displayed.
Sources: AIHW National Hospital Morbidity Database and ABS National, state and territory population.
When comparing First Nations males with First Nations females:
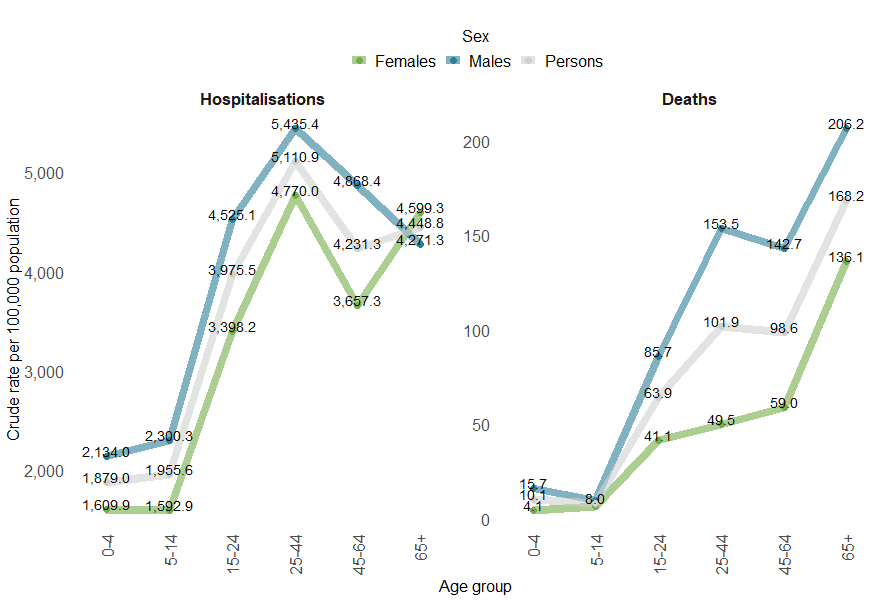
The risk of injury also differed by age among First Nations people (Figure 12). Overall, injury hospitalisations were highest for First Nations people in the 25–44 age group, with around 5,100 cases per 100,000 persons.
Figure 12: Crude rates of injury hospitalisations (2022–23) and deaths (2021–22) among First Nations people by sex, Australia
Notes:
- Crude rates per 100,000 population.
- Person totals include hospitalisations where the sex of the patient was other, inadequately described or not stated.
Source: AIHW National Hospital Morbidity Database, AIHW National Mortality Database, and ABS National, state and territory population.
The leading cause of death for First Nations people was suicide (17.9 per 100,000 persons, Table 1).
| External cause of injury | Number: Males | Number: Females | Number: Persons | Crude mortality rate: Males | Crude mortality rate: Females | Crude mortality rate: Persons |
|---|---|---|---|---|---|---|
| All external causes | 418 | 182 | 600 | 94.2 | 41.0 | 67.6 |
| Suicide | 111 | 48 | 159 | 25.0 | 10.8 | 17.9 |
| Transport | 66 | 27 | 93 | 14.9 | 6.1 | 10.5 |
| Accidental poisoning | 62 | 24 | 86 | 14.0 | 5.4 | 9.7 |
| Falls | 27 | 19 | 46 | 6.1 | 4.3 | 5.2 |
| Choking and suffocation | 12 | 9 | 21 | 2.7 | 2.0 | 2.4 |
| Homicide | 14 | 6 | 20 | 3.2 | 1.4 | 2.3 |
Notes:
- Deaths data only includes data for New South Wales, Queensland, Western Australia, South Australia, and the Northern Territory.
- The sum of the counts by cause may be greater than the total number of injury deaths because some deaths have multiple causes.
- Cases of under 5 were omitted and the sums of counts do not add up to the total number of all external cases.
Source: AIHW National Mortality Database and ABS National, state and territory population.
Over the past decade, injury hospitalisations among First Nations people have gradually increased from an age-standardised rate of about 3,400 per 100,000 people (about 22,600 cases) in 2013–14, 3,800 per 100,000 (or 28,600 cases) in 2017–18 to about 4,000 per 100,000 in 2022–23 (about 33,400 cases) (Figure 13). The latest rate is a 3.1% increase from the average rate of about 3,900 over the five years from 2017–2022.
The largest increases by cause were for the following:
- a 39% increase in drowning and submersion from an average of 3.5 cases per 100,000 in 2017–22 to 4.8 in 2022-23 (based on age-standardised rates)
- a 20% increase in other unintentional causes from an average of 212.5 cases per 100,000 in 2017–22 to 255 in 2022-23.
The rate of injury hospitalisation for falls increased by 8.5% in 2022–23 relative to the five-year average to about 1,100 per 100,000 persons (age-standardised), that for transport increased 6.1% to 390 per 100,000 persons, assaults decreased by 5.0% to about 860 per 100,000 persons and accidental poisoning decreased by 19% to about 87 per 100,000 persons.
In the decade between 2012–13 and 2021–22, injury deaths among First Nations people have risen from age standardised rates of about 80 per 100,000 (or 420 deaths) to 86 per 100,000 (about 600 deaths). Comparing the age-standardised rate in 2021–22 to the average of the previous five years from 2016–17 to 2020–21, this is an increase of 11%.
Looking at causes where the rate is over 1 per 100,000 people, the largest increases were in:
- choking and suffocation (a 27% increase to 6.6 from the previous 5-year average of 5.2 per 100,000 people)
- transport (a 26% increase to 15 from the previous 5-year average of 12 per 100,000 people).
Homicides decreased by 8.5% to 3.9 from the previous 5-year average of 4.3 per 100,000 people, and accidental poisoning decreased by 2.1% to 15.6 from the previous 5-year average of 15.9 per 100,000 people.
Figure 13: Trends in injuries among First Nations people by cause over the past decade, Australia
Trendline for injury hospitalisations and deaths by causes for First Nations people from 2013-14 to 2022-23
