Severity
The severity or seriousness of an injury can be measured in several ways. Some of these are:
- emergency department presentation metrics such as triage category
- average length of hospital stay (ALOS) measured in days
- time in an intensive care unit (ICU) or receipt of continuous ventilatory support (CVS)
- in-hospital deaths.
ED presentations
About 394,000 injury presentations (21%) arrived by ambulance at an ED
Every presentation to an ED is assigned 1 of 5 triage categories based on the urgency with which the patient requires medical care. Approximately half of all injury related ED presentations are triaged as semi-urgent, with about 40% of all presentations being either urgent, emergencies or for resuscitation (Table 3). Compared to all ED presentations in the year, higher proportions of injury related presentations were triaged as semi-urgent or non-urgent, and lower proportions as urgent or emergencies (Table 3).
| Triage category | Number of injury ED presentations | Percentage of all injury ED presentations (%) | Corresponding percentage of all ED presentations* (%) |
|---|---|---|---|
| 1-Resuscitation | 17,538 | 0.9 | 0.9 |
| 2-Emergency | 191,819 | 10.3 | 16.3 |
| 3-Urgent | 536,614 | 28.9 | 40.4 |
| 4-Semi-urgent | 920,258 | 49.6 | 35.6 |
| 5-Non-urgent | 189.602 | 10.2 | 6.8 |
| Not assigned | 36 | 0.0 | 0.0 |
| Total | 1,855,867 | 100.0 | 21.1 |
Notes:
- * calculated from Supplementary data table 4.2, Emergency department presentations, by triage category and arrival mode, states and territories, 2022–23, MyHospitals Emergency department Care 2022–23 data tables.
- Due to rounding, column percentage totals may not sum to 100%.
Sources: AIHW National Non-admitted Patient Emergency Department Care Database.
Average length of hospital stay
Where known, the three most severe injuries as measured by average length of stay in hospital (by days) were due to falls (5.1 days), thermal causes (4.9 days) and transport (3.5 days).
Figure 19: Average length of stay in hospital (in days) by injury cause and sex, Australia, 2022-23
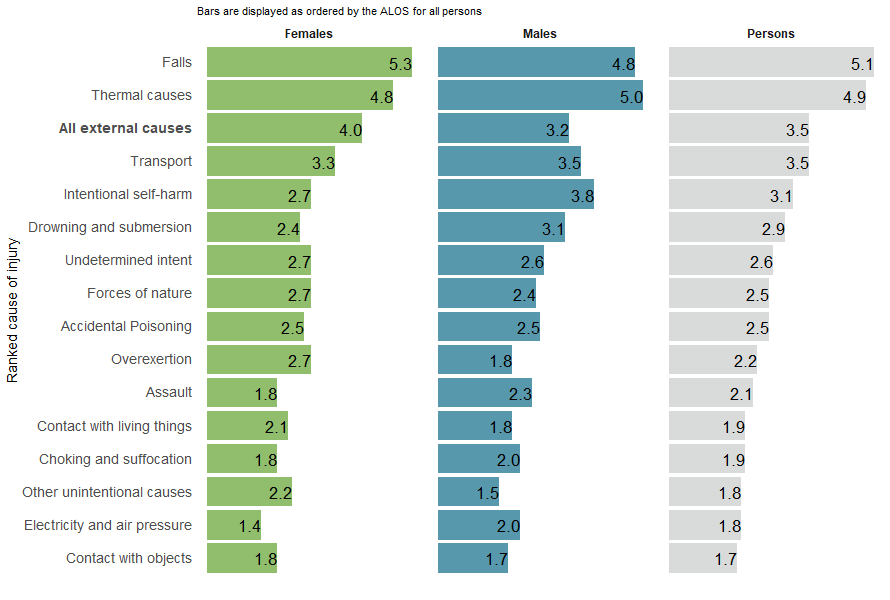
Note: Average length of stay in hospital (in days) by injury cause and sex.
Source: AIHW National Hospital Morbidity Database.
In terms of the most severe injury types, intracranial injuries represented an average length of stay of 5.9 days, internal organ injuries 5.8 days and burns 5.1 days.
Intracranial injuries for males took, on average, the longest time, at 6.3 days in hospital, while for females, internal organ injuries took on average 5.9 days in hospital (Figure 20).
Figure 20: Average length of stay in hospital (in days) by injury type and sex, Australia, 2022-23
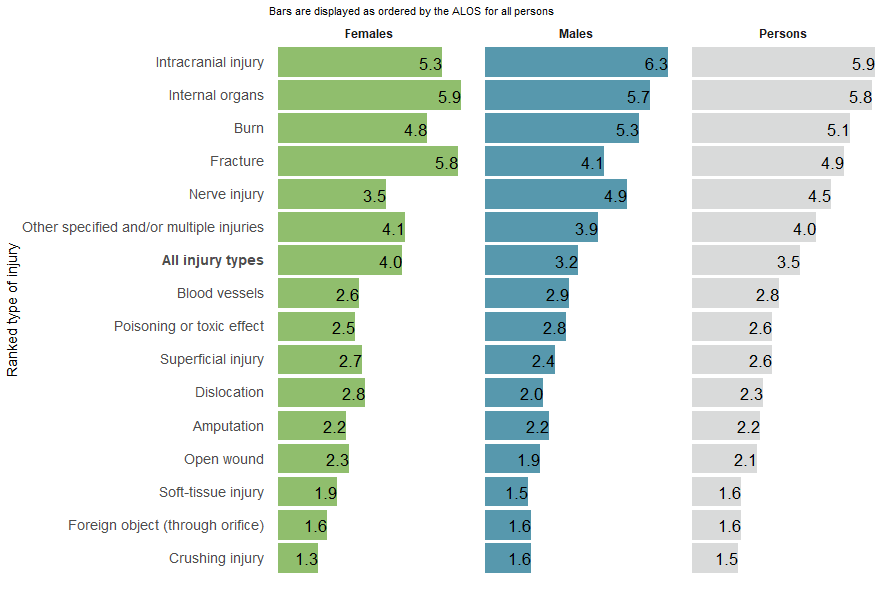
Note: Average length of stay in hospital (in days) by injury type and sex.
Source: AIHW National Hospital Morbidity Database.