The gap in injury hospitalisations and deaths has increased over the past decade (Figure 14), with the likelihood of injury hospitalisations increasing from 1.9 times to 2.2 times between 2013–14 and 2022–23.
Figure 14: Age-standardised rates of injury hospitalisations and deaths by First Nations status over the past decade, Australia
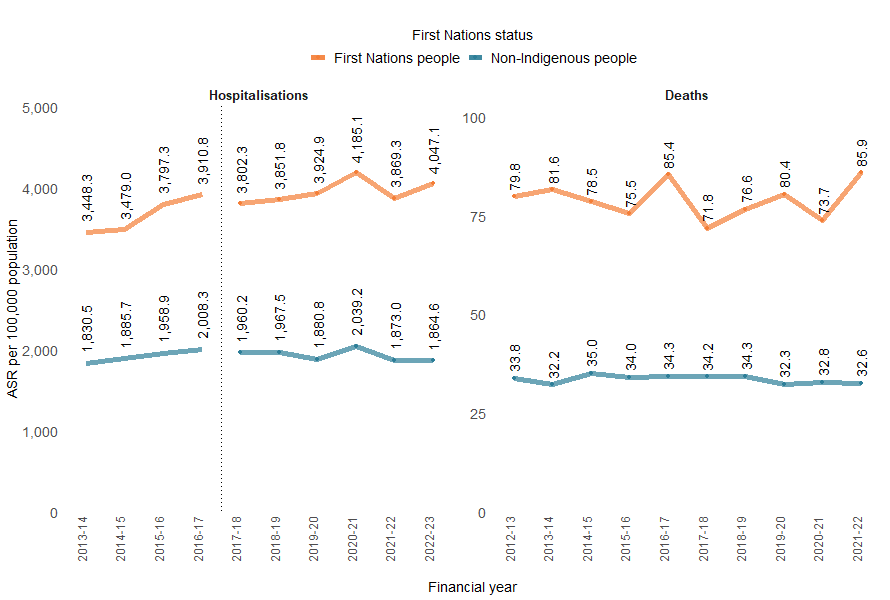
Notes:
- Break in series between 2016-2017 and 2017-18 for hospitalisations data. See technical notes for details.
Sources: AIHW National Hospital Morbidity Database, AIHW National Mortality Database, and ABS National, state and territory population.
When looking at the individual causes of injuries, First Nations people had a higher rate of hospitalisation than non-Indigenous Australians due to:
- assault (around 860 cases, or 55 per 100,000) or 16 times as likely as non-Indigenous people
- intentional self-harm (around 290 cases, or 89 cases per 100,000) or 3.3 times as likely
- thermal causes (around 65 and 19 cases per 100,000) or 3.5 times as likely.
First Nations people experienced higher rates of death by injury as compared to non-Indigenous people across most causes of injury, notably being around 8 times as likely to die due to homicide (Table 2).
| External cause of injury | First Nations ASR | Non-Indigenous ASR | Rate Ratio |
|---|---|---|---|
| Homicide | 3.9 | 0.5 | 7.8 |
| Accidental poisoning | 15.6 | 3.4 | 4.6 |
| Transport | 15.0 | 3.5 | 4.3 |
| Suicide | 26.4 | 8.2 | 3.2 |
| All external causes | 85.9 | 32.6 | 2.6 |
| Choking and suffocation | 6.6 | 2.9 | 2.3 |
| Falls | 15.0 | 12.2 | 1.2 |
Notes:
- Age-standardised rates (ASRs) per 100,000 population.
- Rows with ASR numerators <20 have been omitted from this table.
Sources: AIHW National Mortality Database and ABS National, state and territory population.
For more detail, see supplementary data table H3.