Hospitalisations
In 2022–23, 55% of injury hospitalisations were for males (300,000 cases, ASR of 2,200 per 100,000) and 45% in females (249,000 cases, ASR of 1,600 per 100,000). Males were more likely to be injured and hospitalised across all causes except for:
- falls (about 770 females and 730 males per 100,000)
- intentional self-harm (about 130 females and 65 males per 100,000) (Figure 6).
For injuries caused by contact with objects, males were hospitalised nearly 2.7 times as often as females. Similarly, for transport related injuries, males were hospitalised over twice as often as females.
Figure 6: Number and age-standardised rate (per 100,000 persons) of injury hospitalisation cases by injury cause and sex, Australia, 2022–23
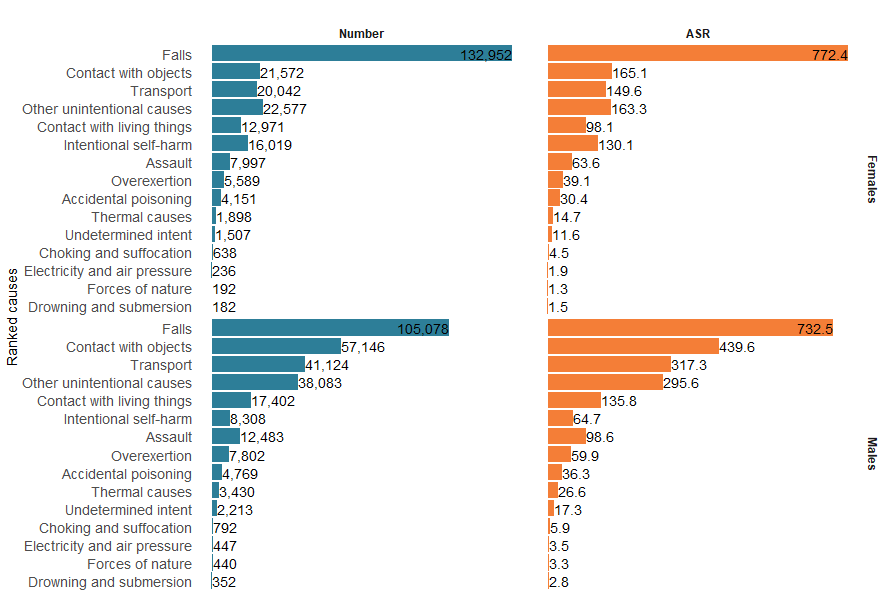
Notes:
- Numbers and age-standardised rates of hospitalisations are represented in rows by sex.
- Age-standardised rates per 100,000 population.
Sources: AIHW National Hospital Morbidity Database and ABS National, state and territory population.
Both hospitalisations and deaths generally increased with age across sexes, with the highest likelihood of injury occurring after age 75 (Figure 7). Adolescents and young adults (ages 10–20) also had slightly higher rates of hospitalisation across both sexes than younger children or working-age adults.
Males were more likely to be hospitalised with injuries than females across all age groups younger than 65, after which females were slightly more likely to be hospitalised. Across age groups, the highest numbers of cases overall were in males aged 20–24 (22,700 cases) and females aged 80–84 (20,200 cases).
Figure 7: Crude rate of injury hospitalisation (2022–23) and death (2021–22), per 100,000 persons, by age and sex, Australia
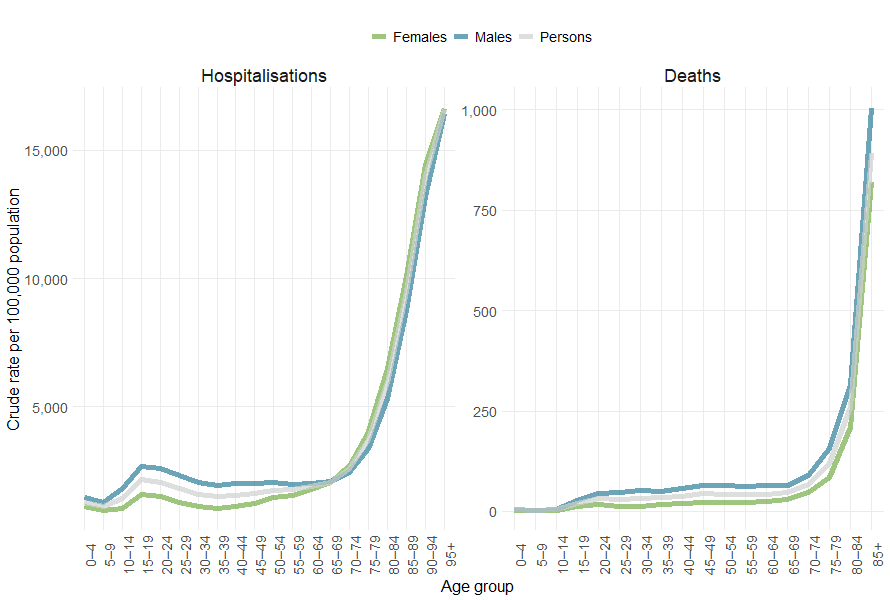
Note: Person totals include hospitalisations where the sex of the patient was other, inadequately described or not stated.
Sources: AIHW National Hospital Morbidity Database, AIHW National Mortality Database, and ABS National, state and territory population.
For more detail, see supplementary data table H1.
Trends by age
Over the past decade, rates of injury hospitalisation have remained steady or decreased slowly for most younger age groups but increased for adults aged 45+ (Figure 8).
Figure 8: Trends in injury hospitalisations and deaths by age over the past decade
Injury hospitalisation and death trend data, by age group over the past decade.
