Region and socioeconomic status
Remoteness and socioeconomic disadvantage impact the risk of injuries. Residents of rural areas experience higher rates of injury hospitalisation and death compared to people who live in urban areas (Mitchell and Chong 2010). Road traffic deaths are more likely in low socio-economic areas, while accidental poisoning and intentional self-harm fatalities are more likely in high socio-economic areas (Peden and Franklin 2020).
Crude rates of injury are presented below but will be updated to age-standardised rates upon availability of appropriate denominator population data. Please see the technical notes for further information.
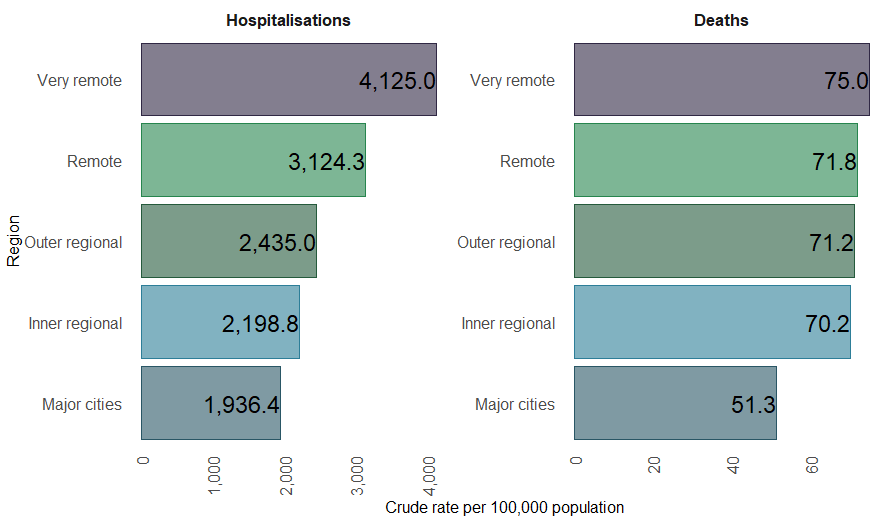
Remoteness
In 2022–23, injury hospitalisation rates indicated Major city dwellers were the least likely to be hospitalised due to injury across regions (about 369,000 cases, with a crude rate of 1,900 per 100,000 people). The number of injury hospitalisations decreased with remoteness to about 8,100 cases in Very remote areas, however crude rates increased with remoteness. Very remote areas had the highest rate per resident population (about 4,100 per 100,000 persons) (Figure 15).
For deaths in 2021–22, rates were lowest in Major cities (about 9,600 cases, a crude mortality rate of 51 per 100,000 people), increasing with remoteness (145 cases in Very remote areas, a rate of about 75 per 100,000 people) (Figure 15).
Figure 15: Crude rates of injury hospitalisations (2022–23) and deaths (2021–22) by remoteness, Australia
Notes:
- Deaths data presented are from 2021–22 and hospitalisations for 2022–23.
- Crude rates per 100,000 population.
- Rates for injury hospitalisations and deaths by remoteness will be updated from crude to age-standardised in the 2nd half of 2024.
Sources: AIHW National Hospital Morbidity Database, AIHW National Mortality Database, and ABS National, state and territory population.
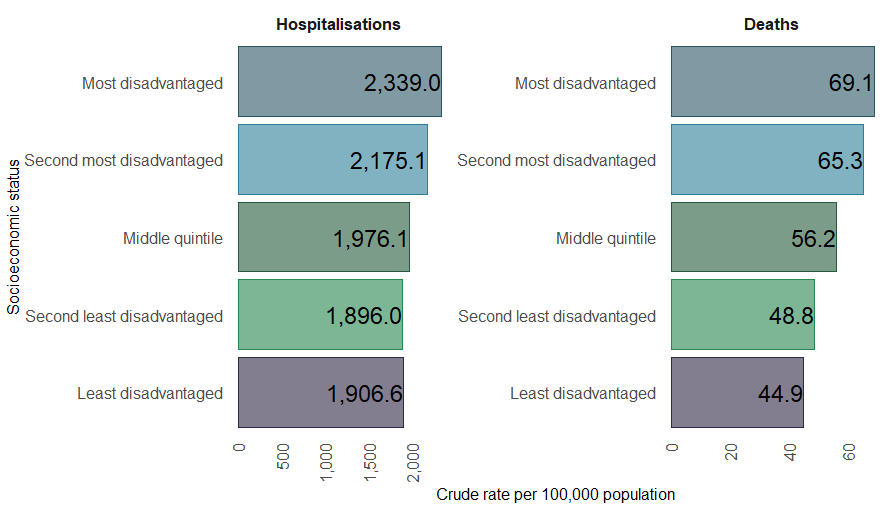
Socioeconomic disadvantage
In 2022–23, both the number and rate of injury hospitalisations were highest among the most socioeconomically disadvantaged quintile of the population (about 116,000 cases, 2,300 per 100,000 people). The number of injury hospitalisations decreased with affluence to about 99,600 cases in the least disadvantaged quintile of the population. This represented a crude rate of about 1,900 per 100,000 people which was similar to the rate for the second least disadvantaged quintile (Figure 16).
For deaths in 2021–22, there was a clear trend with rates increasing with disadvantage. The number and rate were highest among those most disadvantaged (about 3,400 cases, a crude mortality rate of 69 per 100,000 people), decreasing to about 2,300 cases in the least disadvantaged quintile of the population (a rate of about 45 per 100,000 people) (Figure 16).
Figure 16: Rates of injury hospitalisations (2022–23) and deaths (2021–22) by socioeconomic status, Australia
Notes:
- Deaths data presented are from 2021–22 and hospitalisations for 2022–23.
- Crude rates per 100,000 population.
- Rates for injury hospitalisations and deaths by remoteness will be updated from crude to age-standardised in the 2nd half of 2024.
Sources: AIHW National Hospital Morbidity Database, AIHW National Mortality Database, and ABS National, state and territory population.
References
Mitchell RJ & Chong S (2010) Comparison of injury-related hospitalised morbidity and mortality in urban and rural areas in Australia. Rural and Remote Health 10:123-33.
Peden AE and Franklin RC (2021) Exploring the Impact of Remoteness and Socio-Economic Status on Child and Adolescent Injury-Related Mortality in Australia. Children (Basel) 8(1):5.