Overview of the population in need of palliative care
The population in need of palliative care has been estimated to include 109,059 people aged 40+ years who died from 10 selected underlying causes of death in 2019–20 (see Appendix Table A3, based on the Murtagh (2014) minimal estimate). It captures 80% of the 135,617 people who died from predictable deaths in 2019–20.
Population in need of palliative care is older and more likely to die from non-malignant conditions than the SPC population
The age profile of the population in need of palliative care was slightly older on average than the SPC population – median age at time of death of 83.0 years compared with 79.7 years. The population in need of palliative care was, however, slightly younger than the population not receiving SPC (83.0 vs 85.4 years; see Supplementary Tables 1 and 4 for further details).
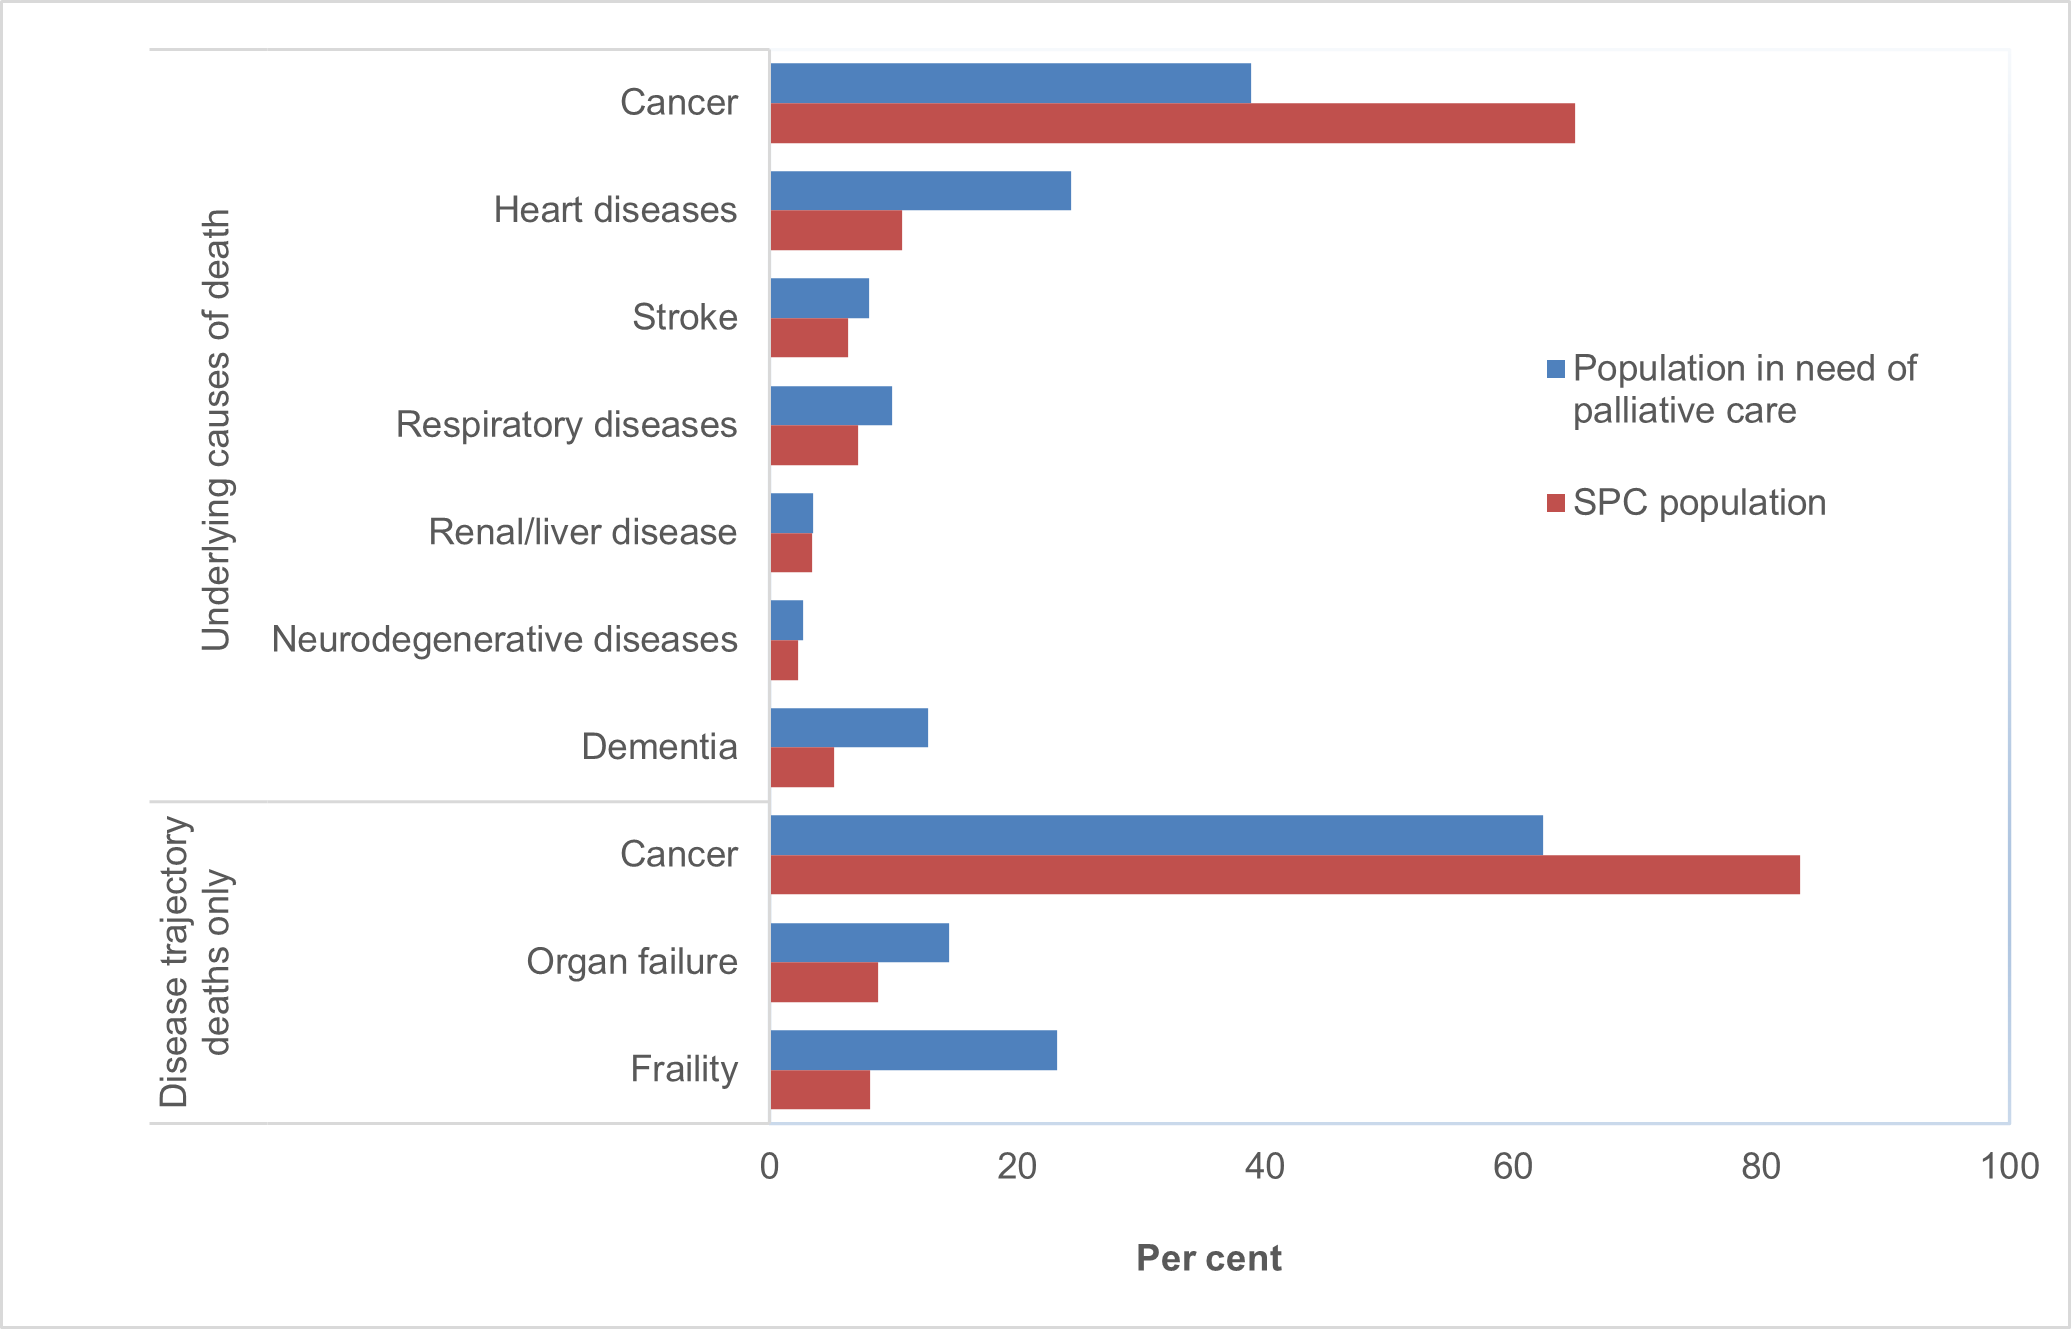
Restricting the population in need of palliative care to people who died from underlying causes of death commonly associated with 3 broad end-of-life disease trajectories (see Appendix Table A2 and Appendix C.3), captured almost 2 in 3 (62% or 68,052 people) of the population in need of palliative care.
Of these 3 disease trajectory deaths:
- almost 2 in 3 (62%) were from cancer (also labelled as 'terminal illness, malignant neoplasm').
- 14% from organ failure, with COPD accounting for 61% of these organ failure deaths or 8.8% of the total disease trajectory deaths (see Figure 4.2 and Supplementary Table 4).
- 23% from frailty, with dementia accounting for 87% of these frailty deaths or 20% of the total disease trajectory deaths (see Figure 4.2 and Supplementary Table 4).
- Of the 109,059 individuals in the population in need of palliative care, 44,237 (40.6%) had received SPC (its SPC sub-population). Of this 44,237, 34,546 (78%) were classified into one of the 3 end-of-life trajectories. The relative frequency distribution of these 3 trajectories is dominated by cancer (83%, see Figure 4.1).
Figure 4.2: Relative frequencies (%) of the 3 end-of-life disease trajectories, for the whole population in need of palliative care, compared with its SPC sub-population
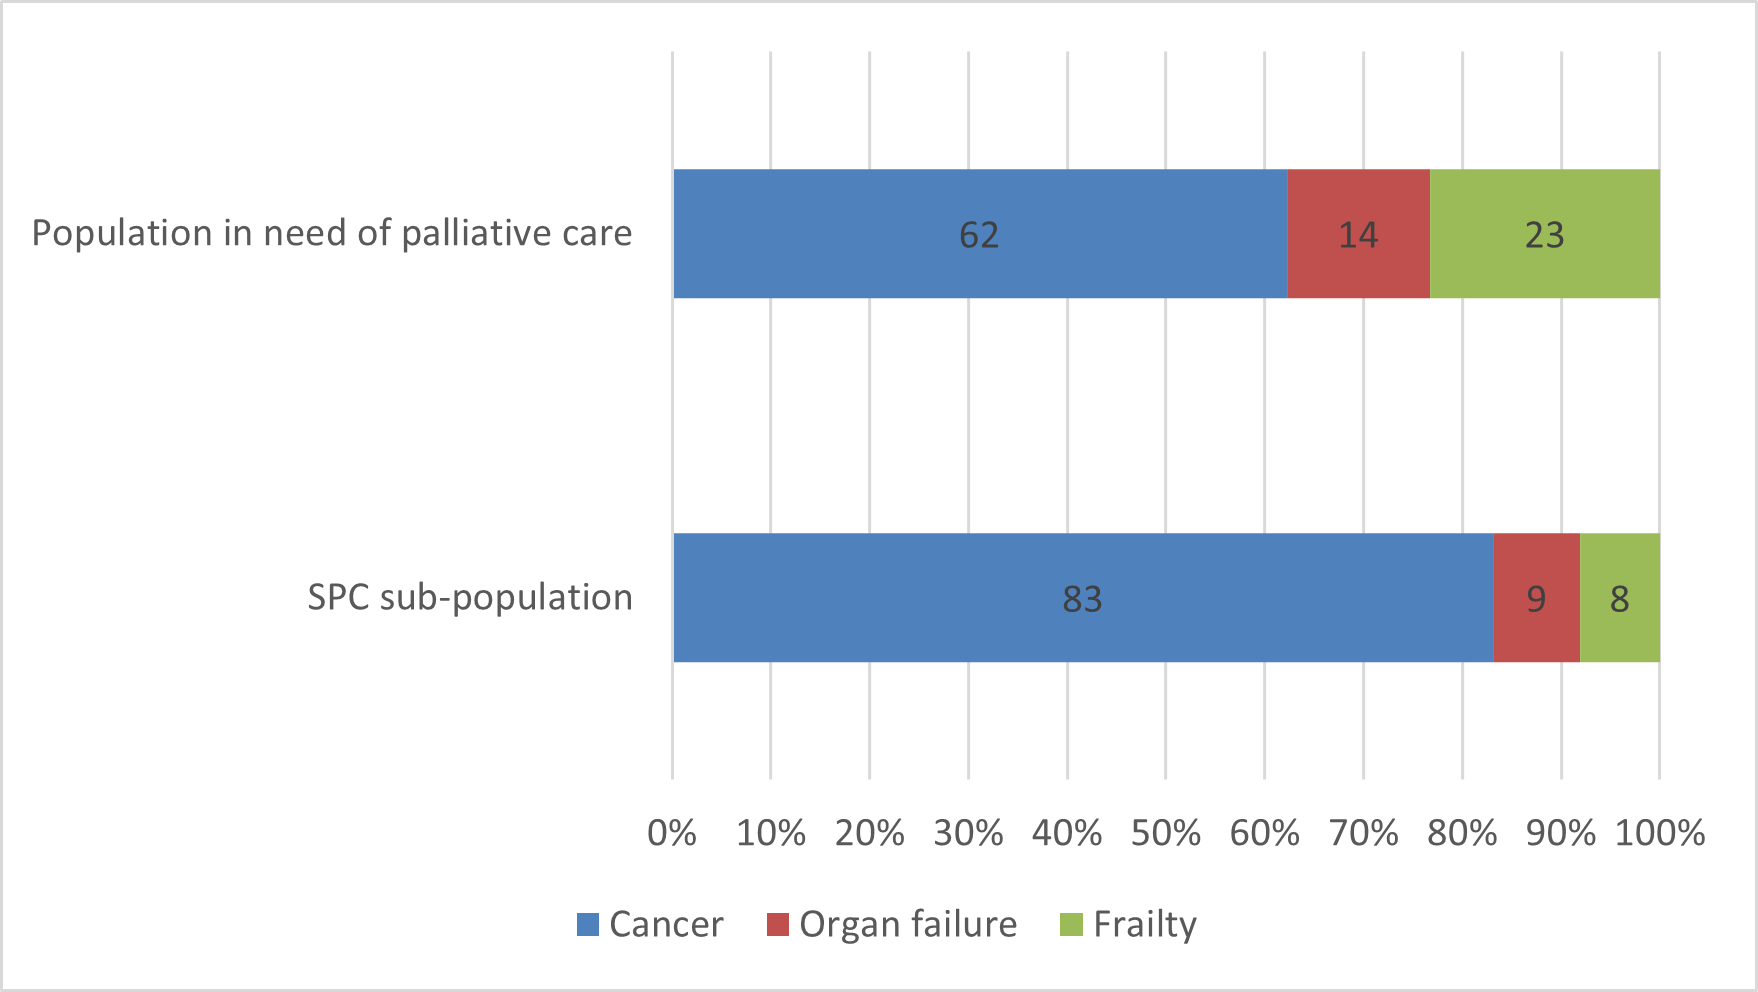
Note: The proportions for the end-of-life disease trajectory deaths are based on deaths from these causes only (62% of deaths in the palliative care need population, and 78% of its SPC sub-population). Other causes of death are not included here.
Source: Supplementary Table 5.
Types of services received
Of the 109,059 people in the population in need of palliative care, nearly all (96%) had received a specialist palliative care (SPC) or other relevant service in the last year of life. Additionally, 94% had visited a GP in the last year of life. Consultations with specialists were also common, with over 1 in 2 (55%) having at least 1 consultation with specialists who treat common life limiting conditions (based on MBS-subsidised claims). Further, over 2 in 5 (44%) received allied health services through MBS or palliative care outpatient clinics (see Supplementary Table 5b).
Note: Specialist palliative care is defined as services (inpatient hospital, out-patient clinics, Medicare-subsidised services) provided by palliative medicine physicians/specialists. Other relevant services are defined as services outside of specialised palliative care settings or providers, including attendances with GPs and nurses, consultations with non-palliative care specialists, and allied health services (see Section 2.2).
Less than half of population in need of palliative care received SPC, driven by the proportion of people with non-malignant conditions who are less likely to receive SPC
Around 2 in 5 (41% or 44,237) of the population in need of palliative care received SPC in the last year of life. Of these, 4 in 5 (80%) received hospital inpatient care (see Supplementary Table 5b).
The population in need of palliative care dying from cancer were at least twice as likely to receive SPC than people dying from organ failure and frailty – 68% compared with 31% and 18%, respectively (see Supplementary Table 5c). This is consistent with previous results highlighting the low receipt of SPC for non-malignant conditions.
Consultations with non-palliative care specialists are far more common for population receiving SPC than population not receiving SPC
The population in need of palliative care receiving SPC were more likely to have consultations with non-palliative care specialists who treat common life limiting conditions than those who did not receive SPC (71% compared with 43%, respectively). As shown in Figure 4.3, the population receiving SPC were more likely than those not receiving SPC to have consultations with oncologists (47% vs 12%), cardiologists (30% vs 22%) and respiratory physicians (15% vs 9%). They were also more likely to visit a GP (97% compared with 92% for population in need of palliative care not receiving SPC).
Consultations with geriatricians and receipt of allied health services were relatively similar for the population in need of palliative care receiving and not receiving SPC – 12% vs 13% for geriatrician consultations and 34% vs 36% for allied health services, respectively (Figure 4.3).
Of the population in need of palliative care who did not receive SPC in the last year of life, 1 in 14 (or 7.3%) did not receive specialist palliative care or other services (as defined in this report; see Supplementary Table 5c).
Figure 4.3: Specialist palliative care and other relevant services received in the last year of life, by whether SPC was received, for the population in need of palliative care
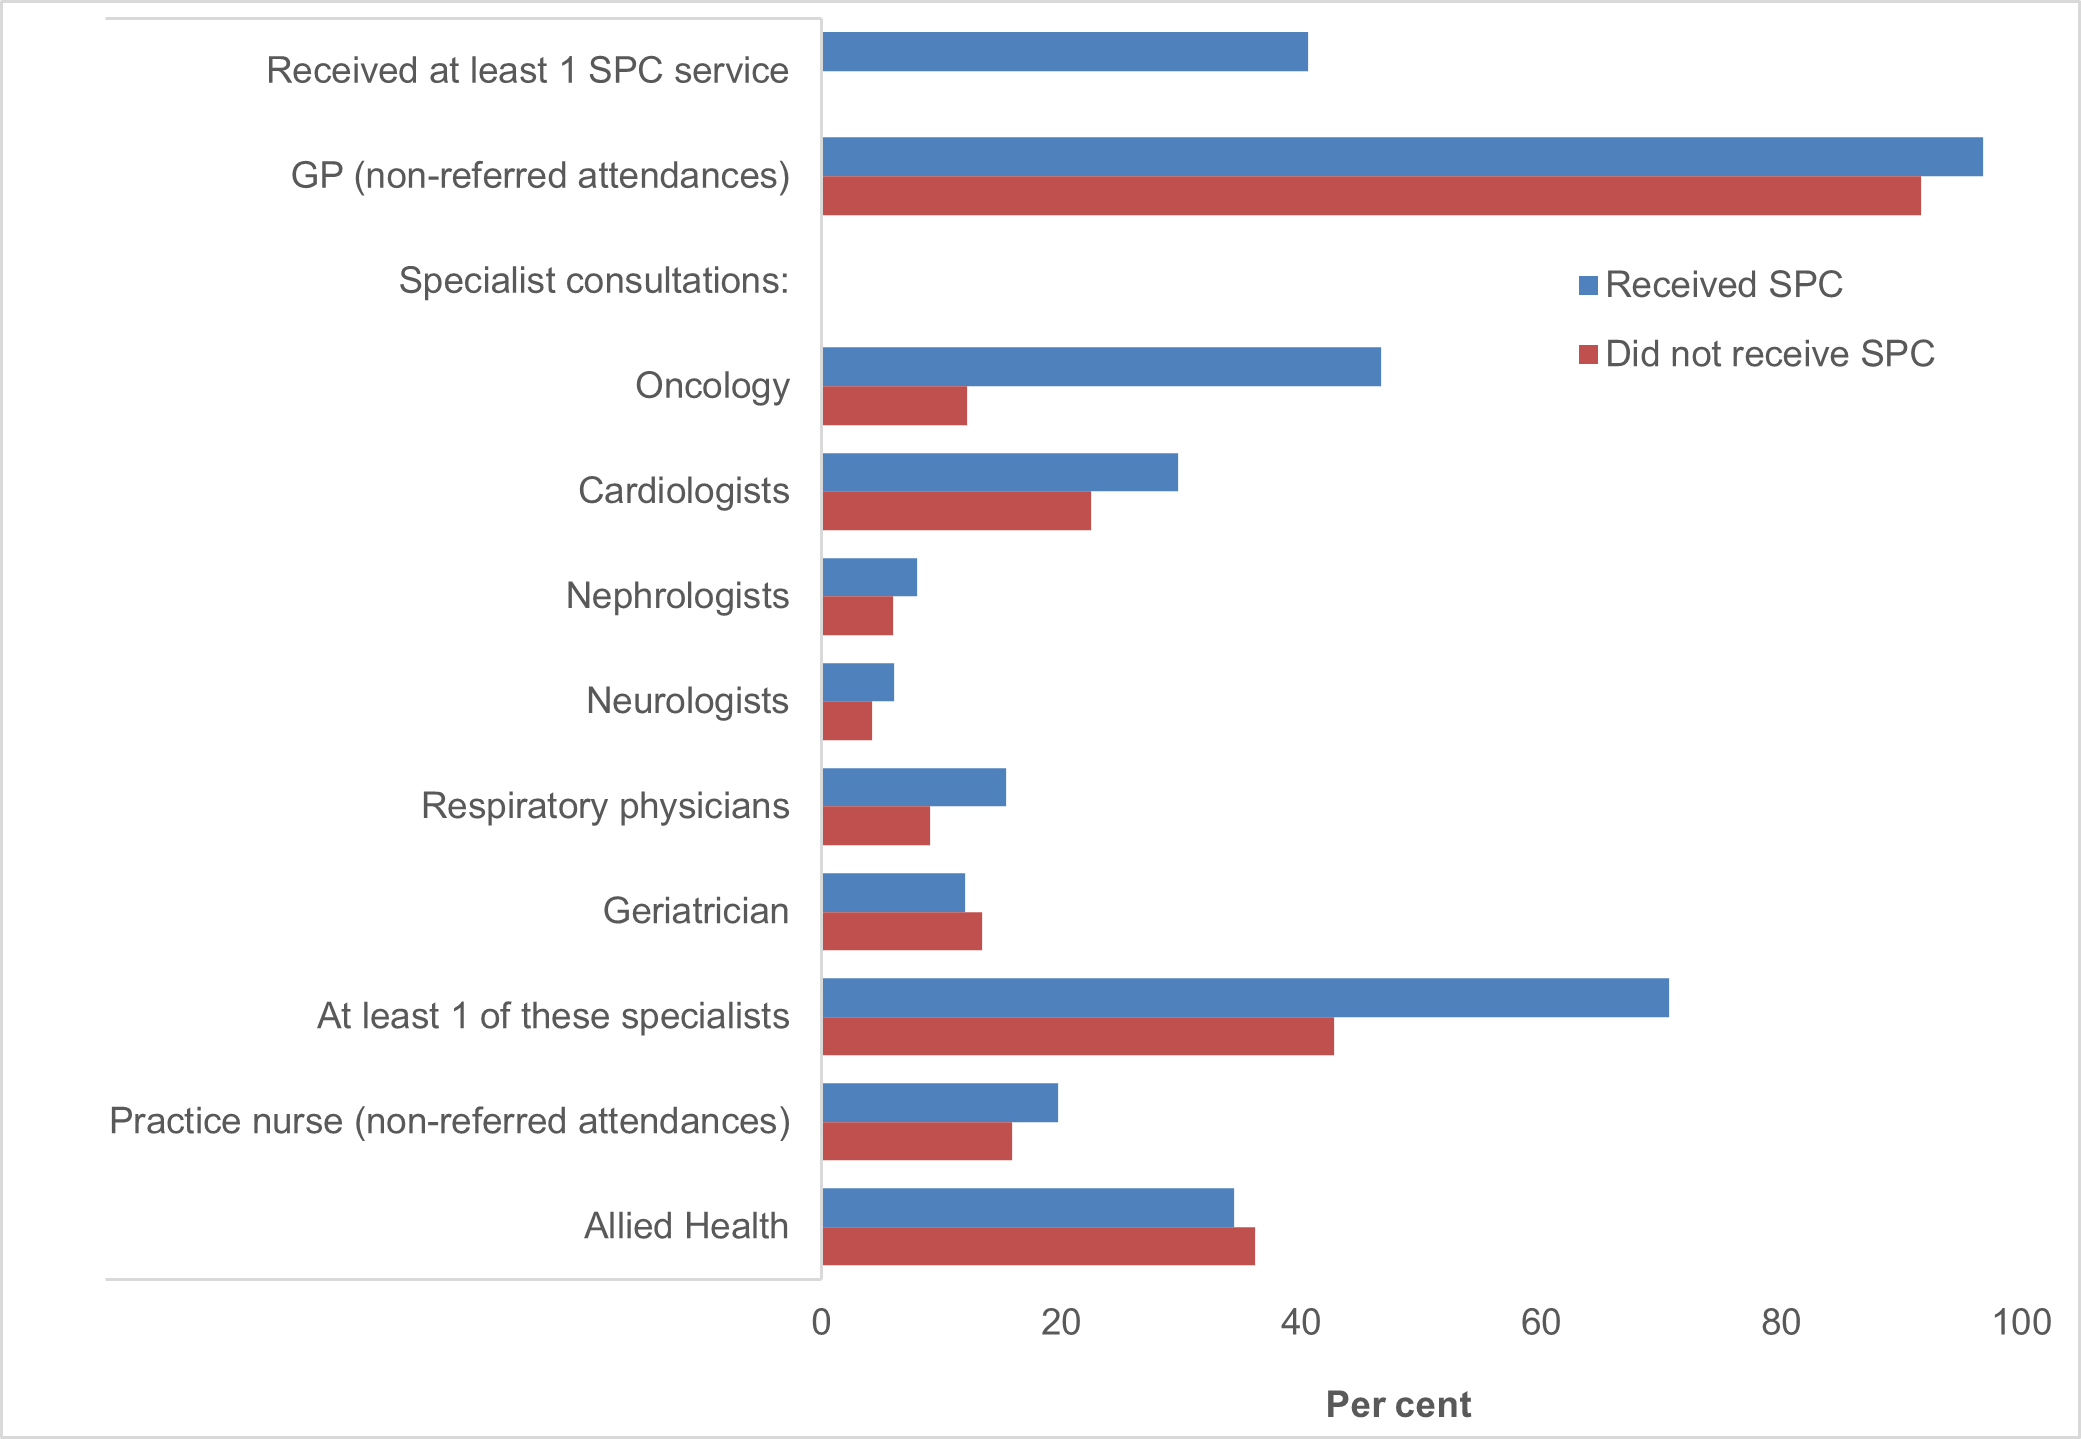
Source: Supplementary Table 5b.
Cancer patients more likely to have consultations with multiple specialists, especially palliative care specialists, than people dying from other causes
People who died from cancer were at least 5 times as likely to have (MBS-subsidised) consultations with palliative care specialists than those dying from organ failure or frailty (21% compared with 3.7% and 2.0%, respectively; Figure 4.4). Indeed, over 4 in 5 (83%) consultations with palliative care specialists were for people who died from cancer (see Supplementary Table 5c). This is consistent with the findings in Chapter 3, which highlighted that cancer patients were the most frequent recipients of specialist palliative care.
Cancer
The population in need of palliative care who died from cancers were also more likely to see multiple specialists than people dying from other disease-trajectory causes (Figure 4.3). Almost 2 in 3 (61%) people dying from cancer had consultations with oncologists, 28% with cardiologists, 21% with palliative care specialists and 16% with respiratory physicians.
19% had seen 3 or more specialists in the last year of life (Supplementary Table 5d), compared with 8.4% and 2.8% for people dying from organ failure and frailty, respectively. This may reflect their need for management of complex symptoms over an extended period.
Organ failure
Of the population in need of palliative care who died from organ failure, 40% had seen 1-2 specialists in the last year of life. As shown in Figure 4.3, consultations were largely with disease-specific specialists, as only 3.7% had consultations with palliative care specialists in the last year of life. Consultations with cardiologists (29%) and respiratory physicians (20%) were the most prevalent, reflecting that 36% of organ failure deaths were from heart failure and 61% from COPD. A considerable proportion also had consultations with geriatricians (13%), consistent with heart failure being highly prevalent in the very old, and almost 3 in 4 (71%) of the population in need of palliative care aged 75 years and over (see Supplementary Table 4).
Frailty
Consultations with geriatricians were far more common than other specialists for people who died from frailty. 22% of the palliative care need population dying from frailty had consultations with geriatricians. This was almost 3 times as high as consultations with cardiologists (8.2%) and far more prevalent than consultations with other specialists (2.0% had consultations with palliative care specialists or respiratory physicians and 4.5% with neurologists).
GP attendances and specialist consultations lower among people dying from frailty than other causes
As shown in Figure 4.3, over 2 in 3 (69%) of the population in need of palliative care dying from frailty had no MBS-subsidised consultations with 7 specialists who treat common life-limiting conditions in the last year of life. This proportion was considerably higher compared to organ failure (52%) or cancer deaths (24%). GP attendances were also slightly lower for the population in need of palliative care dying from frailty than cancer (93% compared with 96%) and attendances with practice nurses were also lower (11% compared with 20% for organ failure and 19% for cancers).
The lower proportion of specialist consultations and GP and nurse attendances for people who died from frailty may reflect that 38% of the predictable deaths population (or 85% of the non-SPC population) with dementia were in residential aged care at the time of death (see Supplementary Table 2). This may limit their access to health care providers given current challenges in delivery of GP and specialist services in residential aged care (Reed 2015).
Figure 4.4: Types and numbers of specialists seen in the last year of life, by end-of-life disease trajectories, for the population in need of palliative care
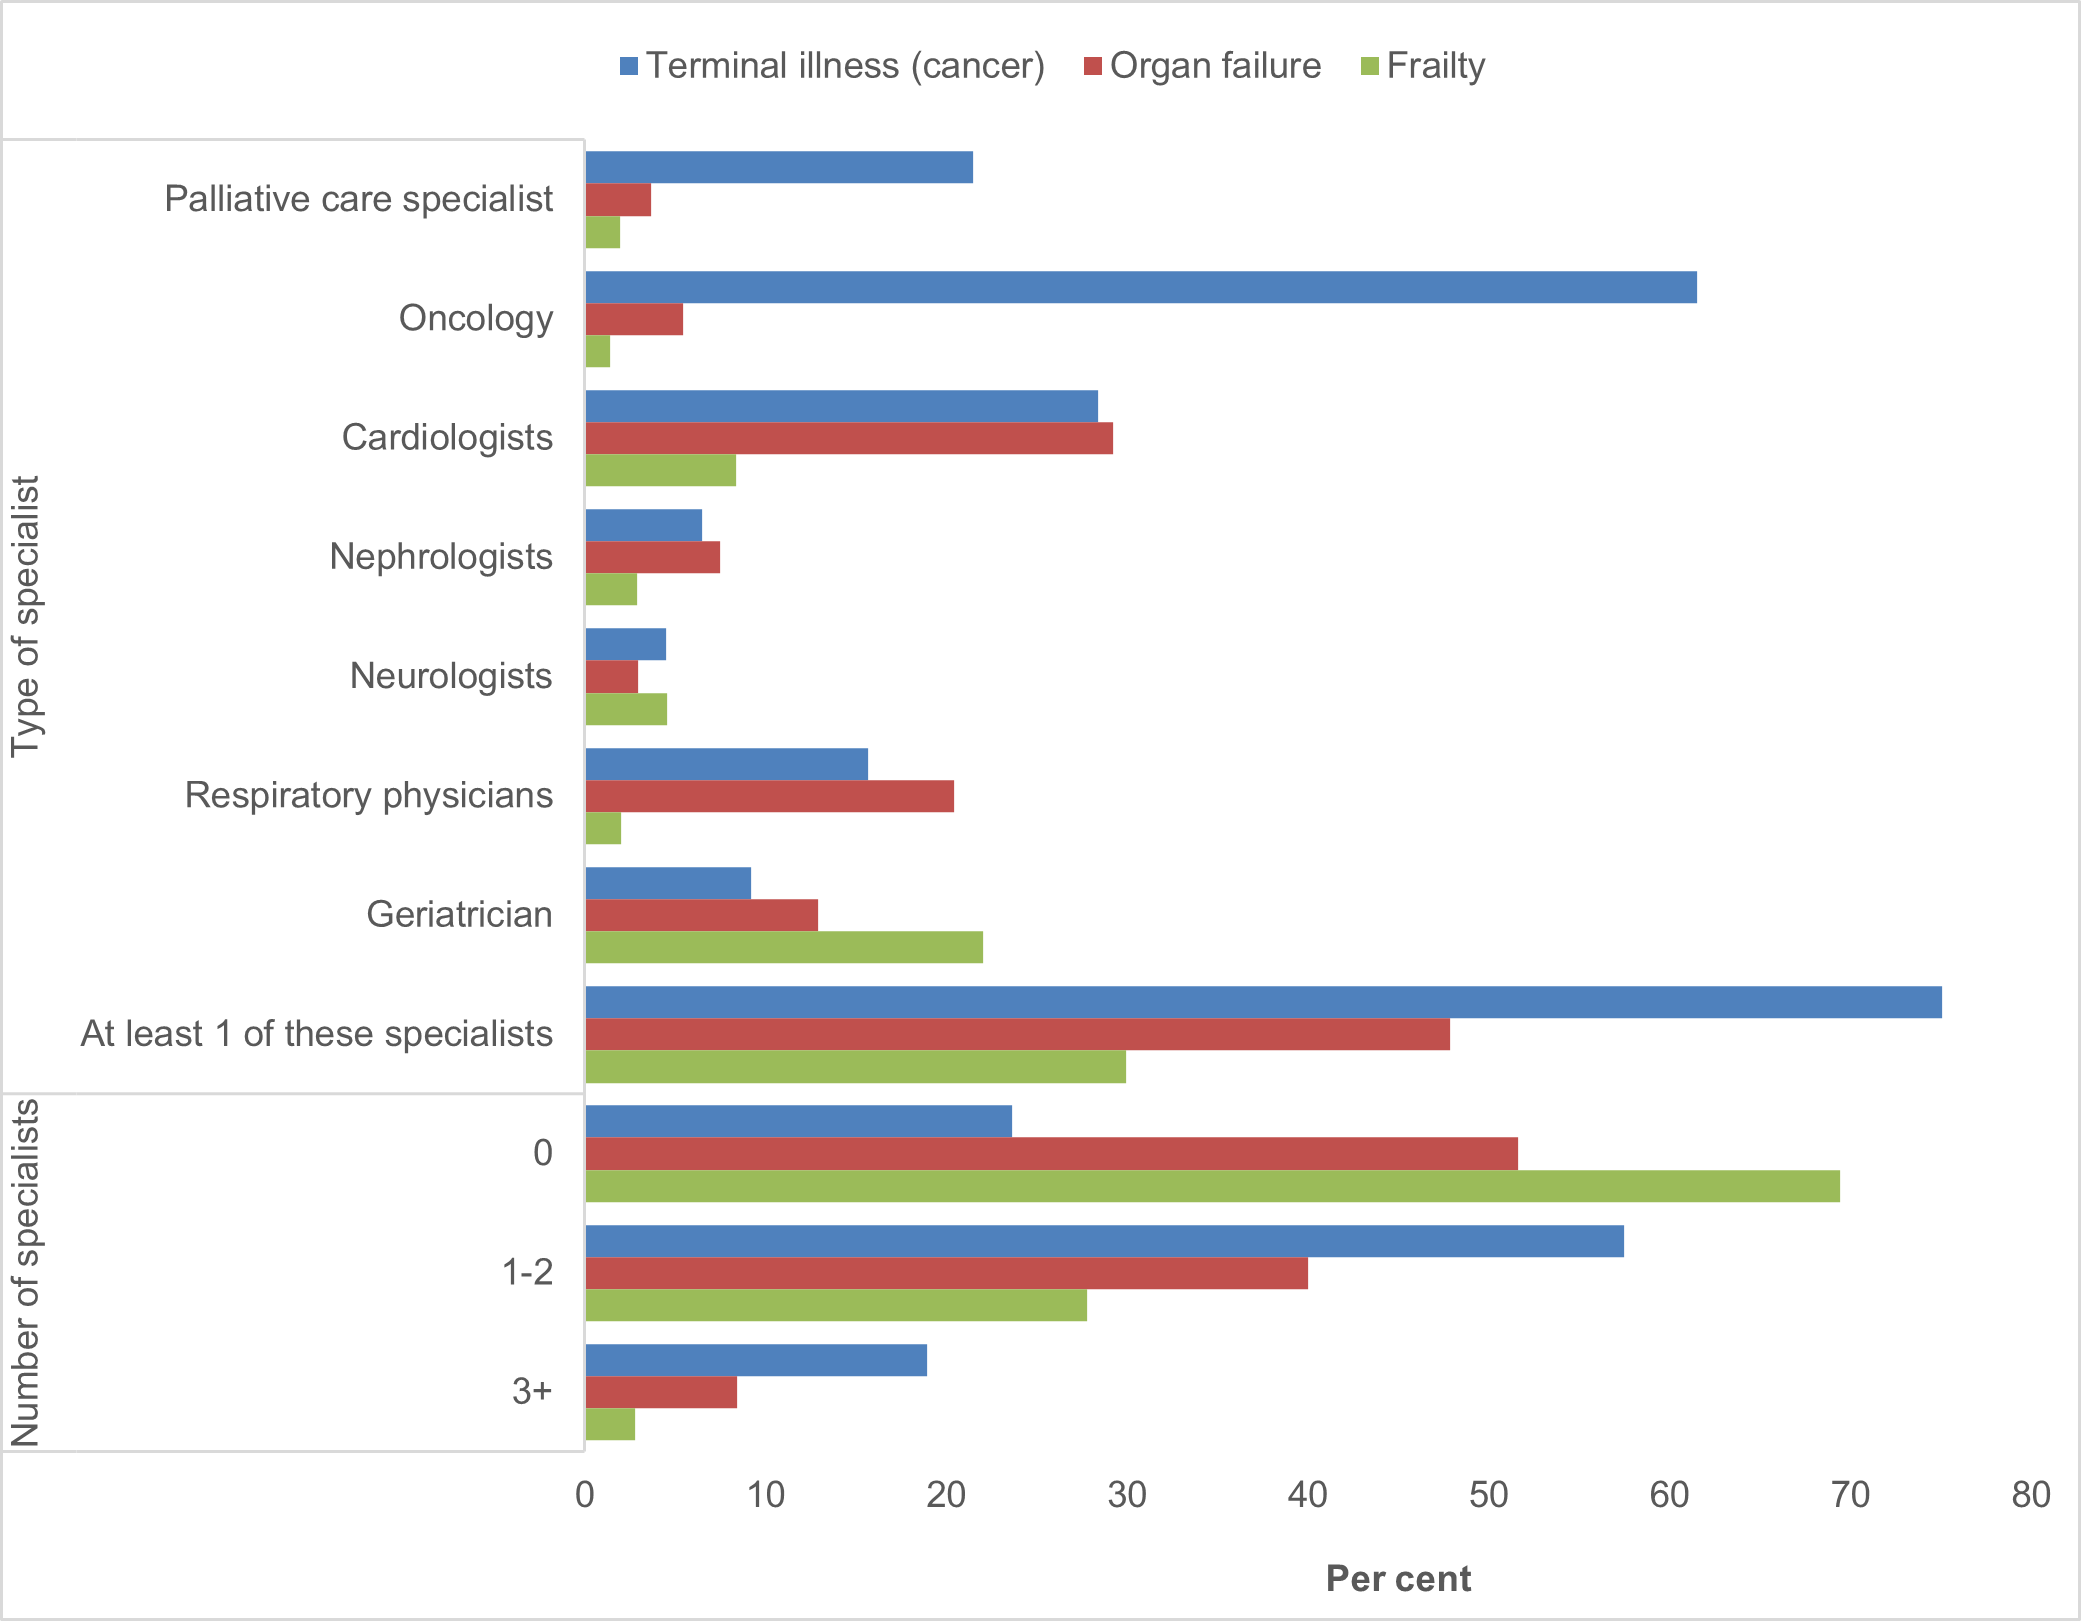
Note: Number of specialists includes 7 relevant specialists who treat common life-limiting conditions – palliative care specialists, oncologists, cardiologists, nephrologists, neurologists, respiratory physicians, geriatricians.
Source: Supplementary Tables 5c and 5d.