Provision of potentially non-beneficial interventions
Exploring the types of potentially non-beneficial treatments received in the weeks before death provides important insights on the management and quality of care provided to patients with life-limiting conditions. For example, some interventions (like chemotherapy, pathology and imaging) are unlikely to provide comfort, prolong life or improve quality of life or have limited benefit in patients with advanced disease apart from management of symptoms and disease progression (OECD 2023). However, it can be difficult for clinicians to discern when a person is approaching the end of life. There is also an element of stigma and distress for patients and families around accepting that curative treatment options have been exhausted. As such, the prevalence of non-beneficial treatments will likely always be present to some extent (M Cardona-Morrell 2016).
Of those receiving chemotherapy, the final treatments were less likely to be in the last 2 weeks of life in the SPC population compared with the population not receiving SPC
There were 7,989 people in the SPC population who received in-hospital chemotherapy in the last year of life, representing 15% of the SPC population as a whole or 28% of the SPC population who died from cancer. The SPC population were 4 times as likely to have received chemotherapy in the last year of life than the population not receiving SPC (3.6%), which reflects the high prevalence of cancer deaths in the SPC population compared with non-SPC population (55% and 16%, respectively; see Overview of the specialist palliative care population).
Among those who received any in-hospital chemotherapy, the SPC population were half as likely to have received their last in-hospital chemotherapy treatment in the 2 weeks before death than people not receiving SPC – 6.6% compared with 12% for people not receiving SPC (Figure 3.8). However, when adjusted for the lower prevalence of any in-hospital chemotherapy among those not receiving SPC, the adjusted prevalence of chemotherapy in the 2 weeks before death was lower in the non-SPC than in the SPC population. The SPC population were most likely to receive their last chemotherapy treatment 1–3 months prior to death, while for the non-SPC population the proportions were relatively similar across the time intervals at least 1 month prior to death (see Supplementary Table 9).
Of those receiving dialysis, the final treatments were less likely to be in the last 2 weeks of life in the SPC population compared with the population not receiving SPC
Among those who received any in-hospital dialysis, the SPC population were less likely to receive in-hospital dialysis in the 2 weeks before death than people not receiving SPC – 51% compared with 66%, respectively (Figure 3.8), like the pattern observed for chemotherapy. However, when adjusted for the lower prevalence of any in-hospital dialysis among those not receiving SPC, the adjusted prevalence of dialysis in the 2 weeks before death was about the same in the non-SPC and SPC populations.
On average, the median number of days from last dialysis treatment to death was longer for the SPC population (13 days) than those not receiving SPC (7 days; see Supplementary Table 9).
Note, there is mixed evidence on whether dialysis at the end of life a potentially non-beneficial or low-value treatment, as it is influenced by prognostic uncertainty, management of symptoms (for example: patients dependent on dialysis until they die), and the needs of the patient (Meeus 2015).
Prevalence of imaging and pathology services were higher and closer to death for SPC than non-SPC populations
The vast majority of the SPC population received MBS-subsidised pathology (93%) and diagnostic imaging (80%) services in the last year of life. These services were more common, especially imaging, than for the non-SPC population (84% for pathology and 56% for imaging for non-SPC population).
Over 1 in 3 (34%) of the SPC population received imaging services in the last month of life – 21% in the last 2 weeks and 13% in the last 2–4 weeks (see Figure 3.8). While these proportions were like the non-SPC population, the SPC population were more likely to have last received imaging services closer to death than the non-SPC population – median number of days from last receipt of imaging service to death of 54 and 66 days, respectively (see Supplementary Table 9).
For pathology services, these were received closer to death than imaging services (median of 28 days and 31 days for SPC and non-SPC populations, respectively). This may reflect the need for more ongoing monitoring of symptoms near the end of life to improve quality of care or treat secondary health concerns (such as infections) to improve comfort, rather than imaging services that are more commonly used for diagnosis and prognosis.
Figure 3.8: Distribution of the number of days from last receipt of specific intervention to death in last year of life, by type of intervention, for SPC and non-SPC populations 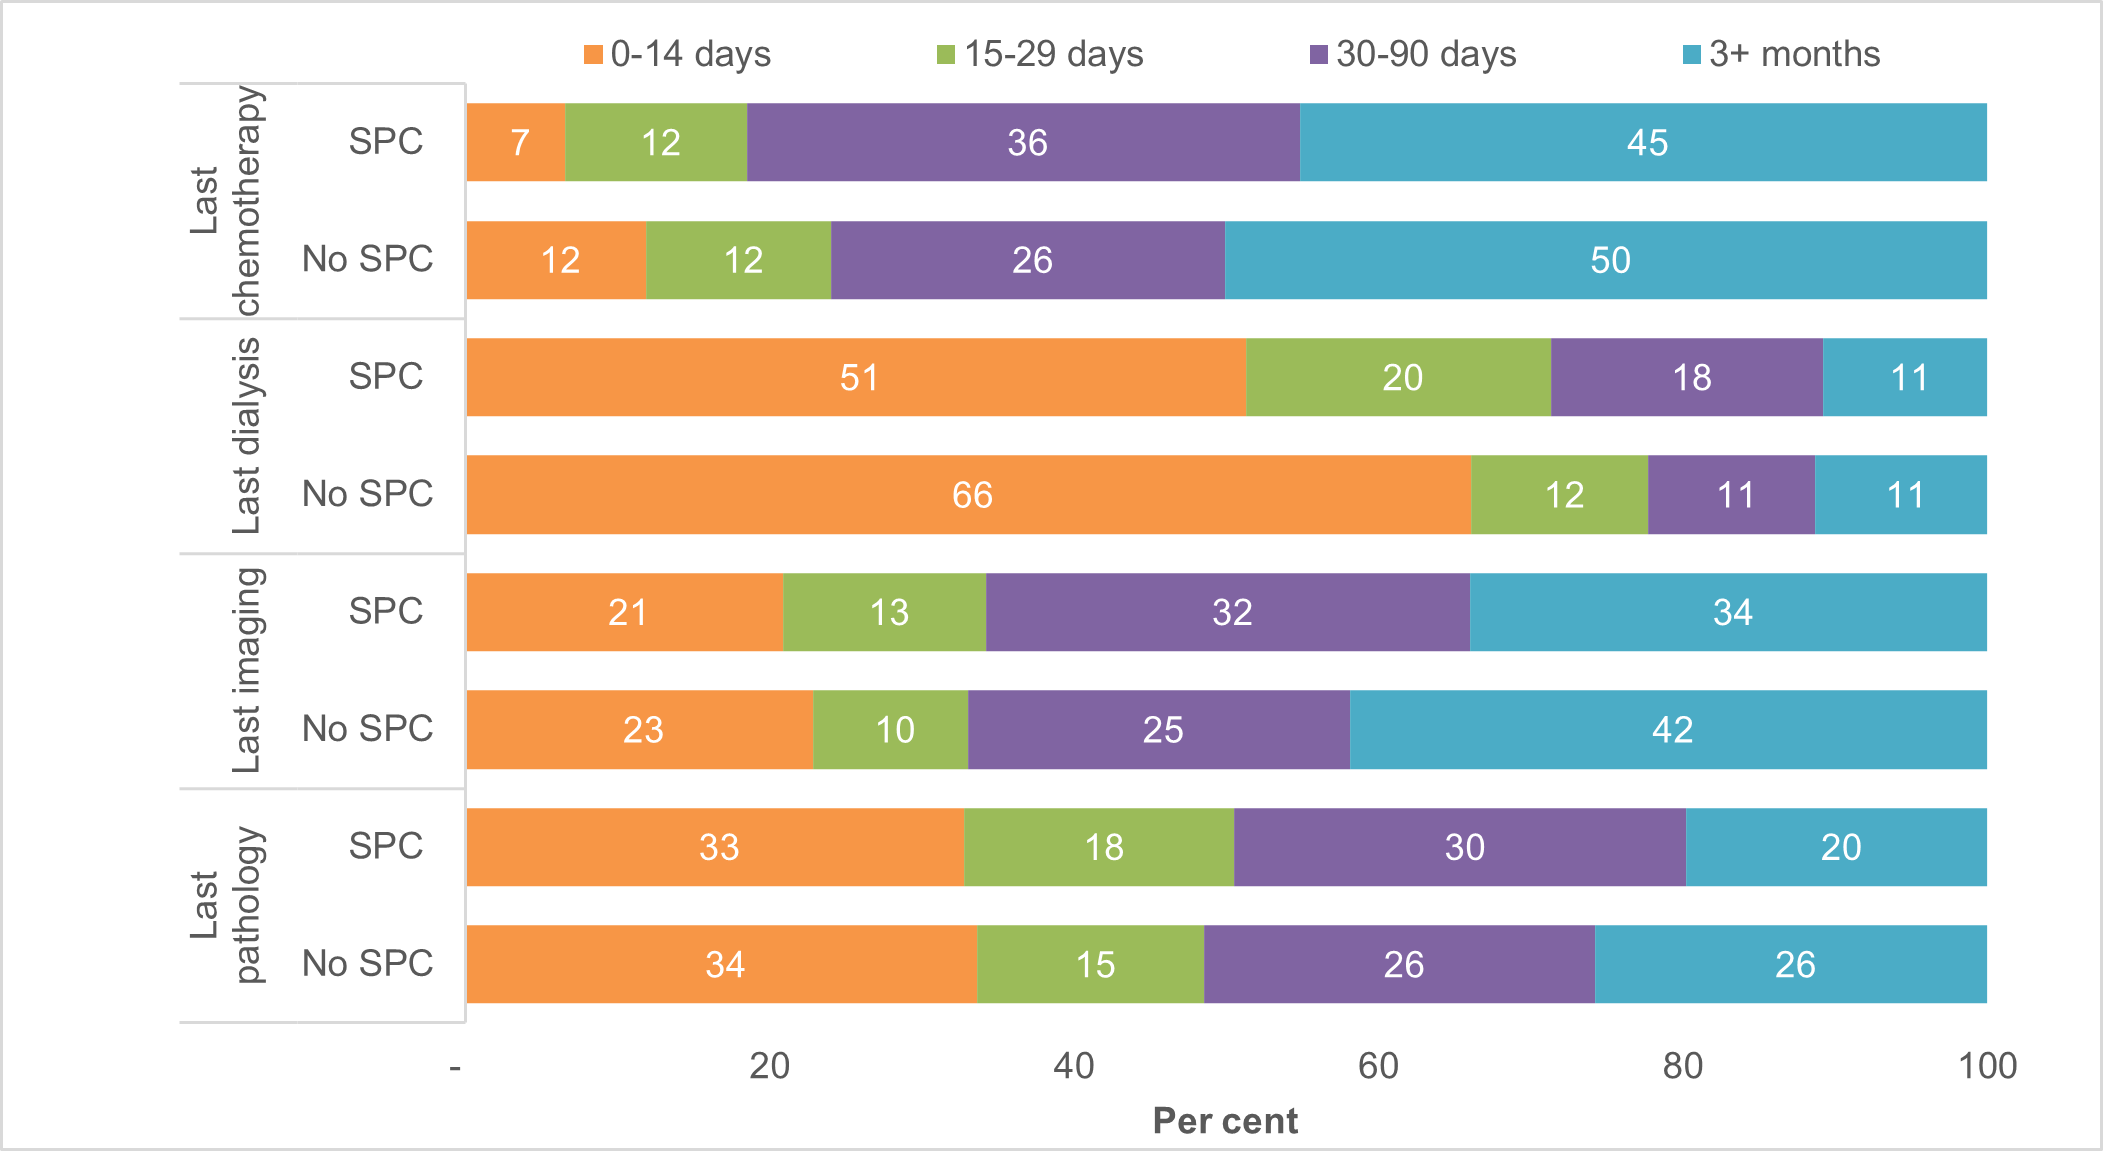
Source: Supplementary Table 9.
Other services and interventions received
2 in 3 had consultations with specialists and 1 in 2 received allied health services in the last year of life
Of the 52,105 people who received SPC in the last year of life and died from predictable deaths in 2019–20 (SPC population), almost all (97%) had visited a GP in the last year of life.
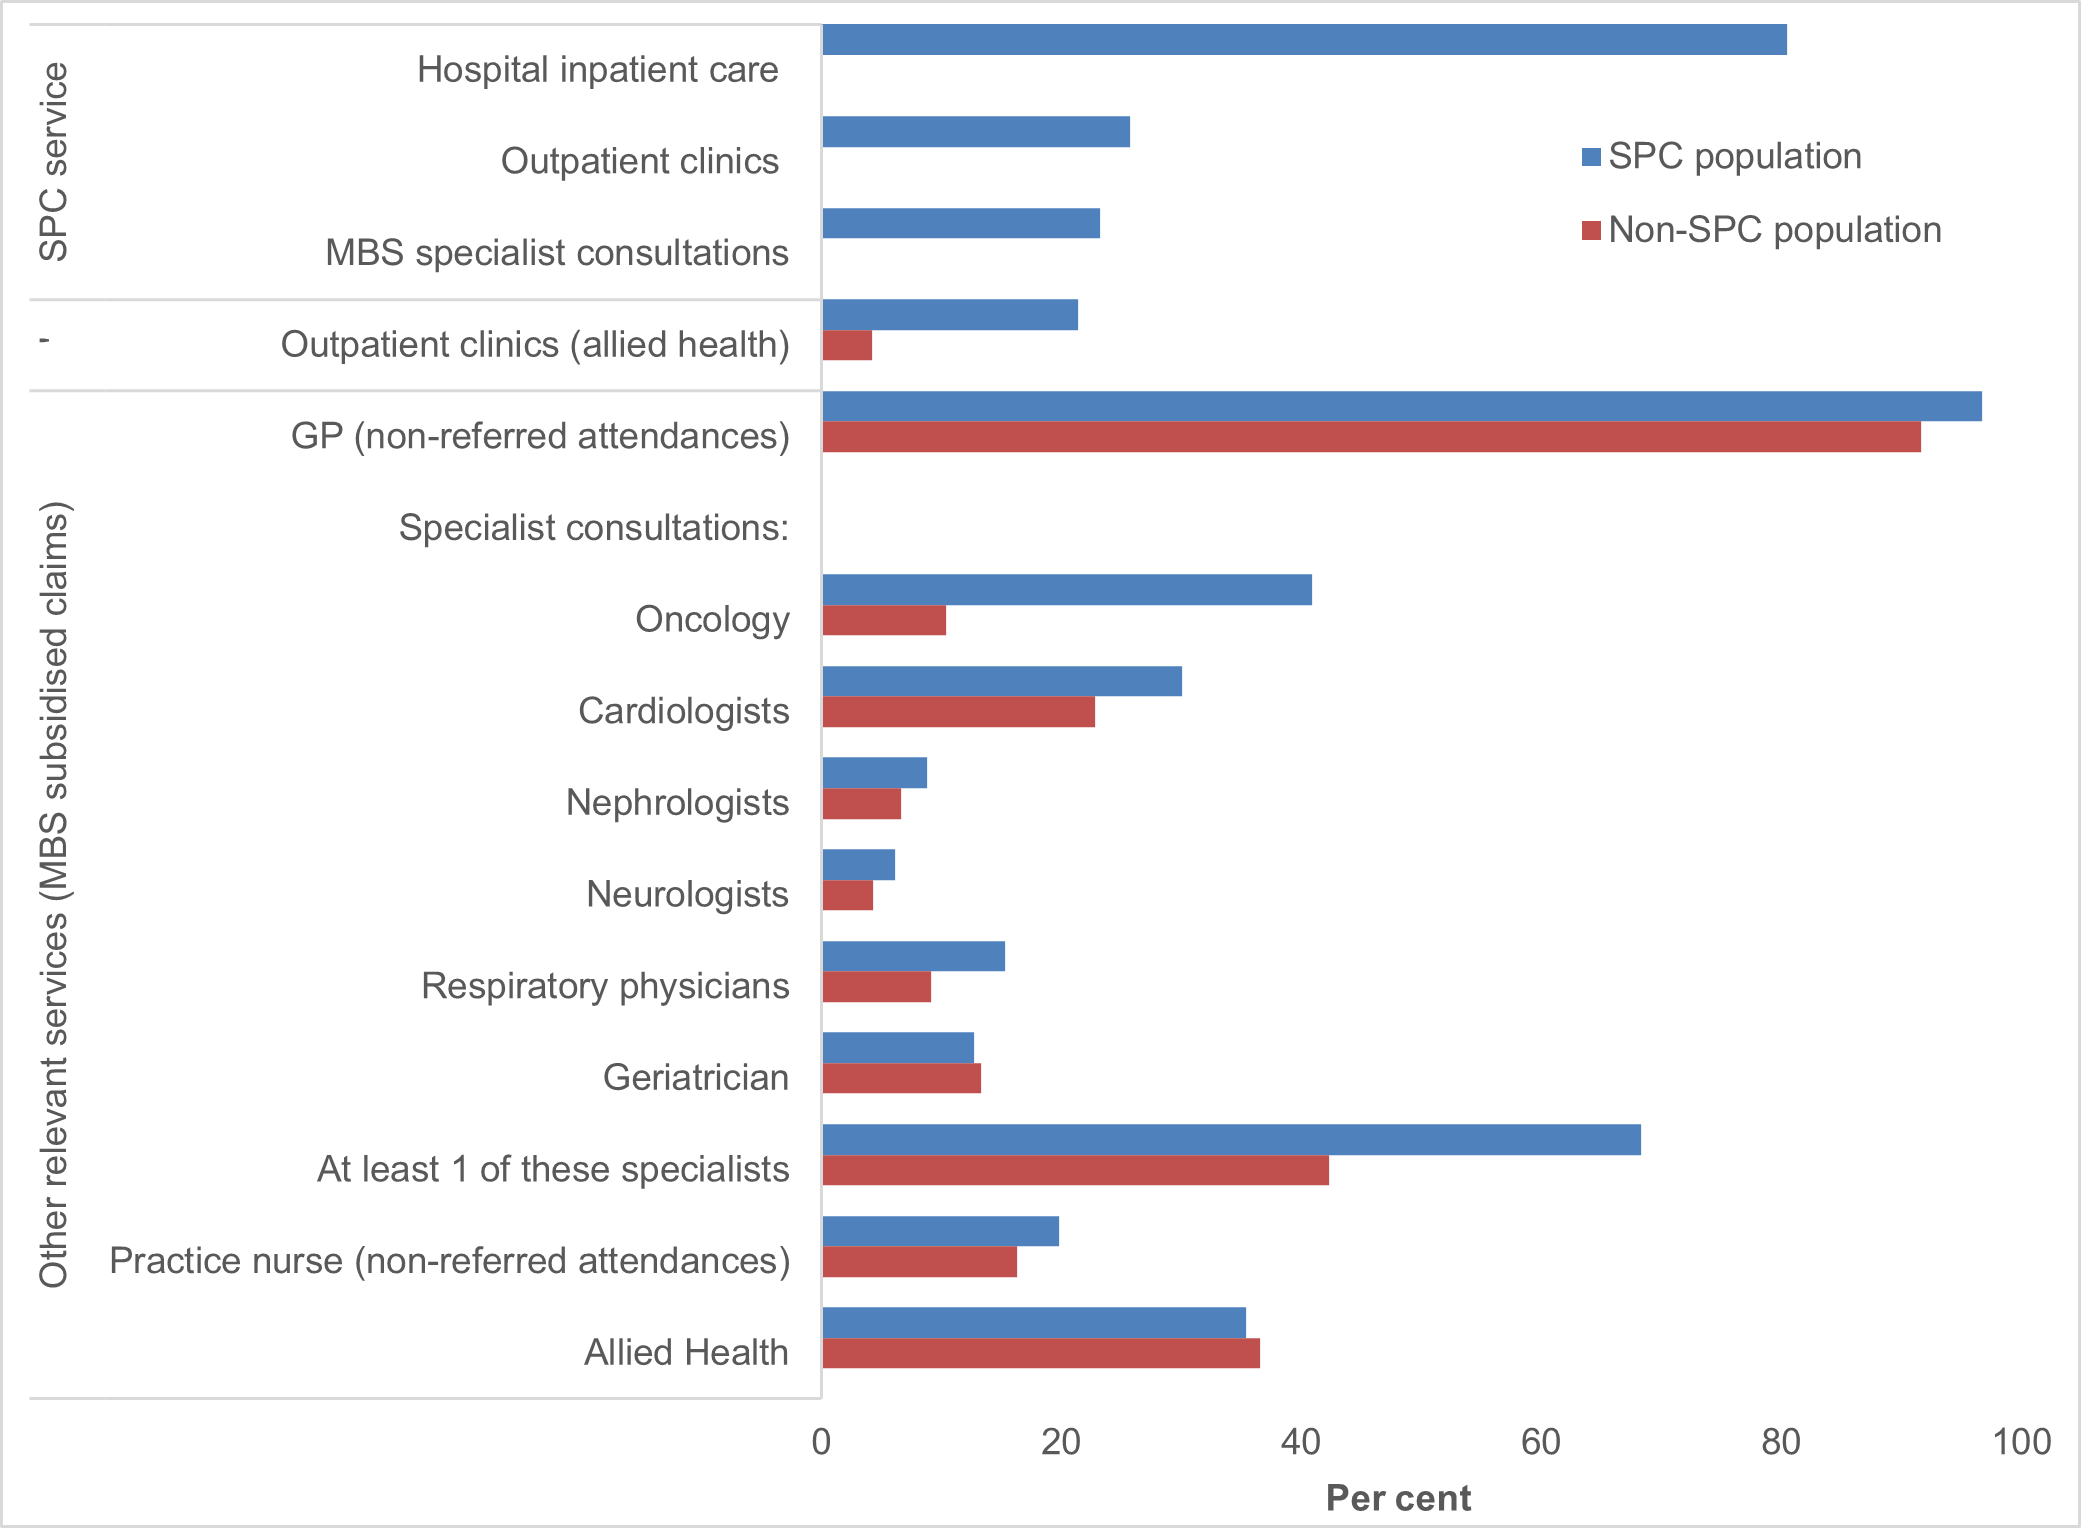
Over 2 in 3 (70% or 36,638) had at least one consultation with specialists who treat common life-limiting illnesses in the last year of life – 23% with palliative care specialist/physicians, 41% with oncologists, 30% with cardiologists, 15% with respiratory physicians and 13% with geriatricians, based on MBS-subsidised claims (see Figure 3.9). This is consistent with the prevalence of the above-mentioned underlying causes of death in Overview of the specialist palliative care population, with cancer accounting for 55% of deaths and circulatory, respiratory, or renal/liver conditions 23% of deaths.
Note: Defined through MBS service provider codes in Appendix Table A1, with the consultation occurring in hospital/consulting room or in other settings (such as a person’s place of usual residence, including home, residential aged care, or institution.
Allied health professionals play a key role in improving the comfort, function, and safety of a person with a life-limiting illness and their families. One in 2 (50%) of the SPC population received allied health services through MBS or palliative care outpatient clinics – 35% received allied health services (through MBS-subsidised claims) and 21% received palliative care allied health and/or clinical nurse specialist intervention in outpatient clinics. Allied health services which were fully paid privately are not included here. A further 1 in 5 (20%) had attendances with practice nurses in non-hospital settings in the last year of life.
As shown in Figure 3.9, for people not receiving SPC, the proportion receiving the above-mentioned services were mostly lower, especially for oncology (11% vs 41% for non-SPC and SPC populations, respectively). Consultations with geriatricians and receipt of allied health services were, however, relatively similar for the SPC and non-SPC populations.
Figure 3.9: Proportion of SPC and non-SPC population receiving SPC services and other relevant services
Source: Supplementary Table 5a.
Palliative specialist consultation services more likely to occur in the month prior to death, while other specialist services occur at least 6 months prior to death
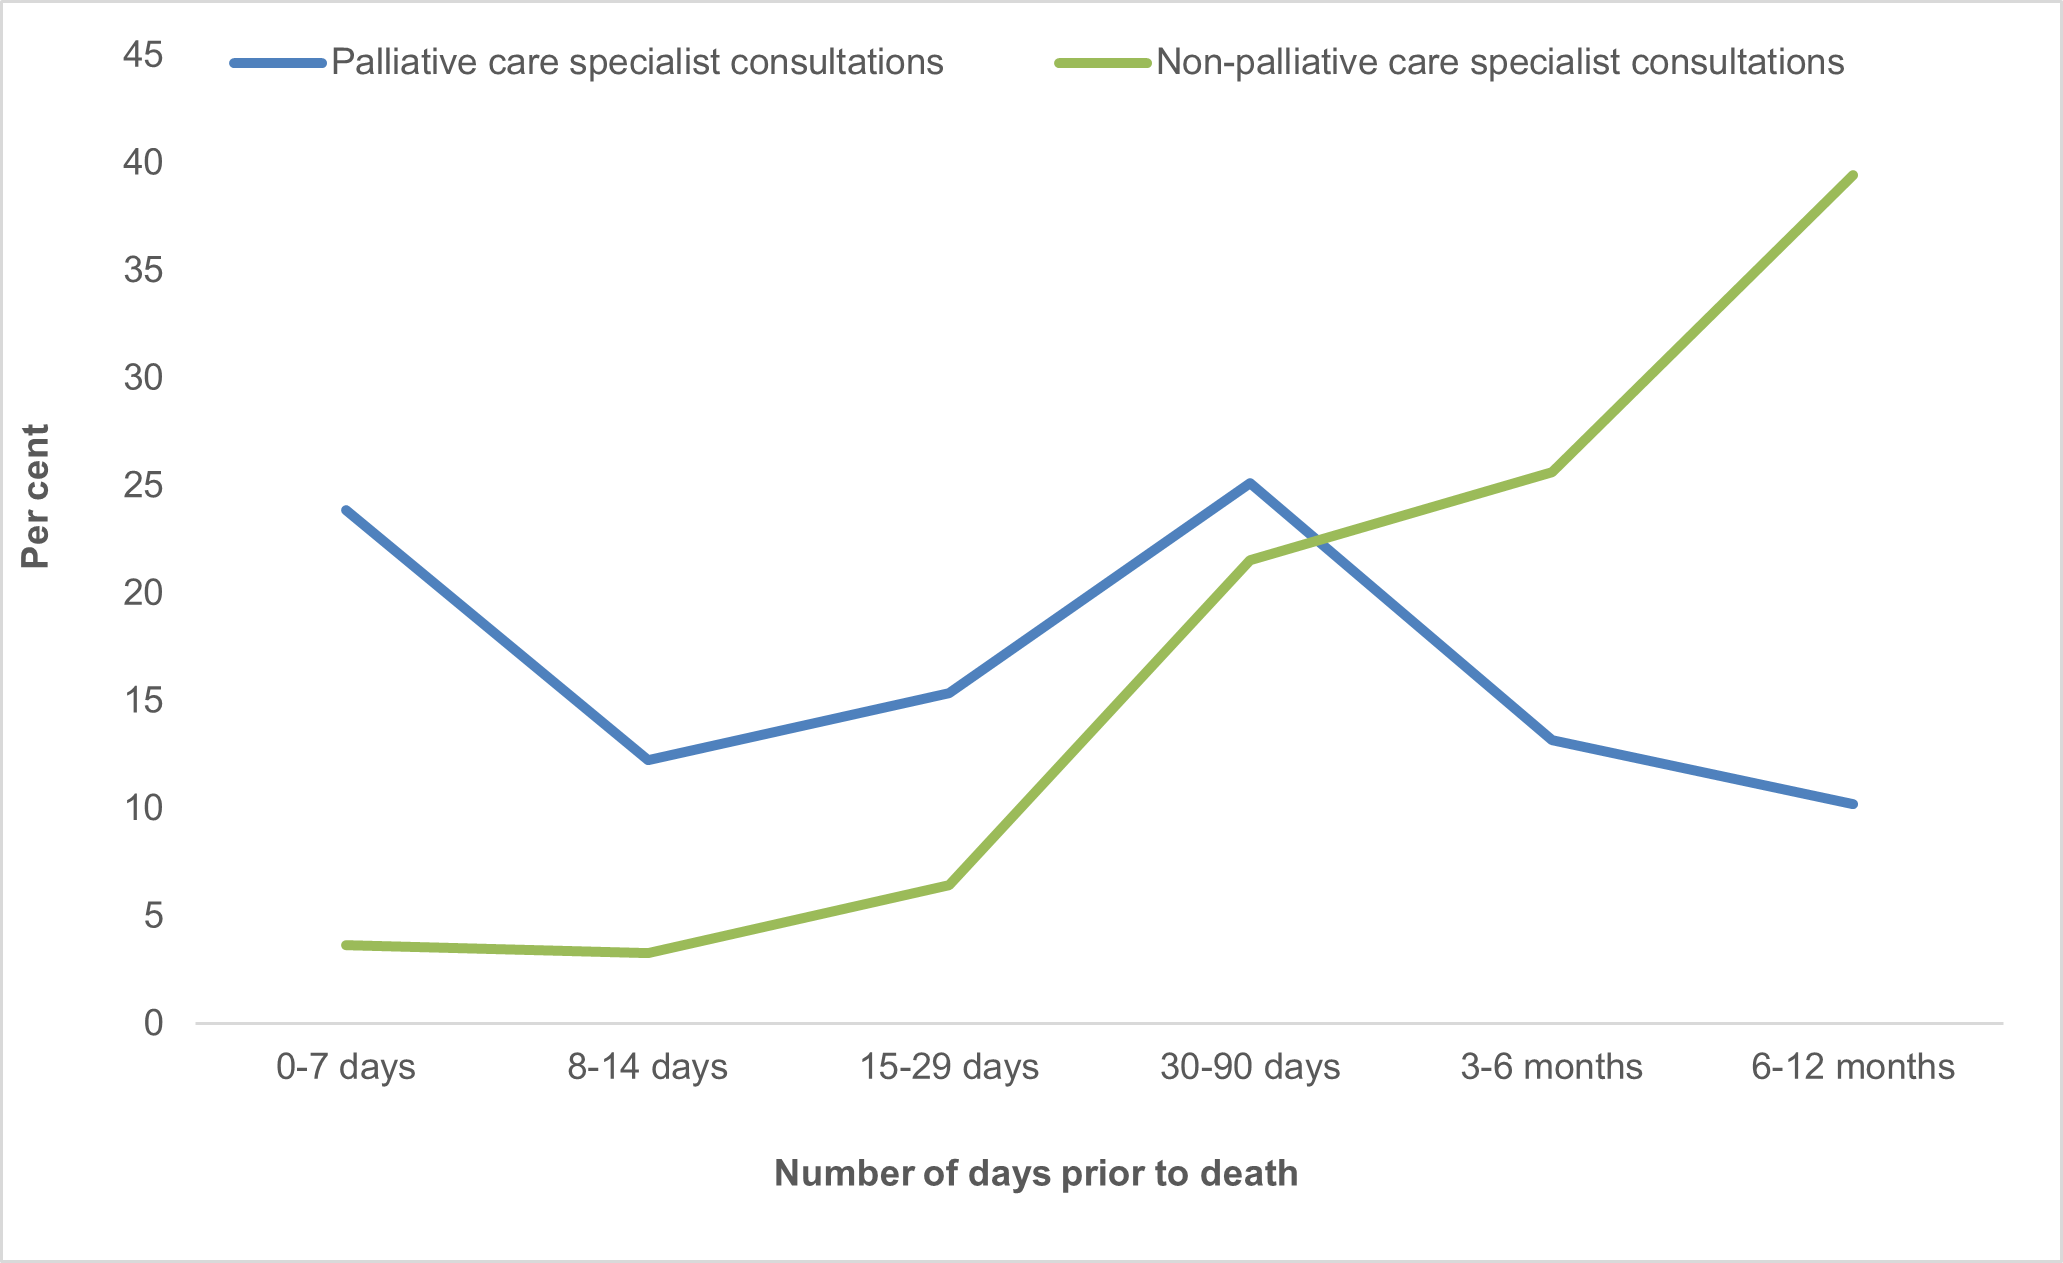
Of the 76,089 MBS palliative specialist consultation services in the last year of life for the SPC population, over 1 in 2 (52%) of these services were received 1 month prior to death, including 24% in the last week of life. The number of palliative specialist consultations declines sharply at least 3 months prior to death, with 13% of services received at 3-6 months and 10% at 9-12 months before death, as shown in Figure 3.10.
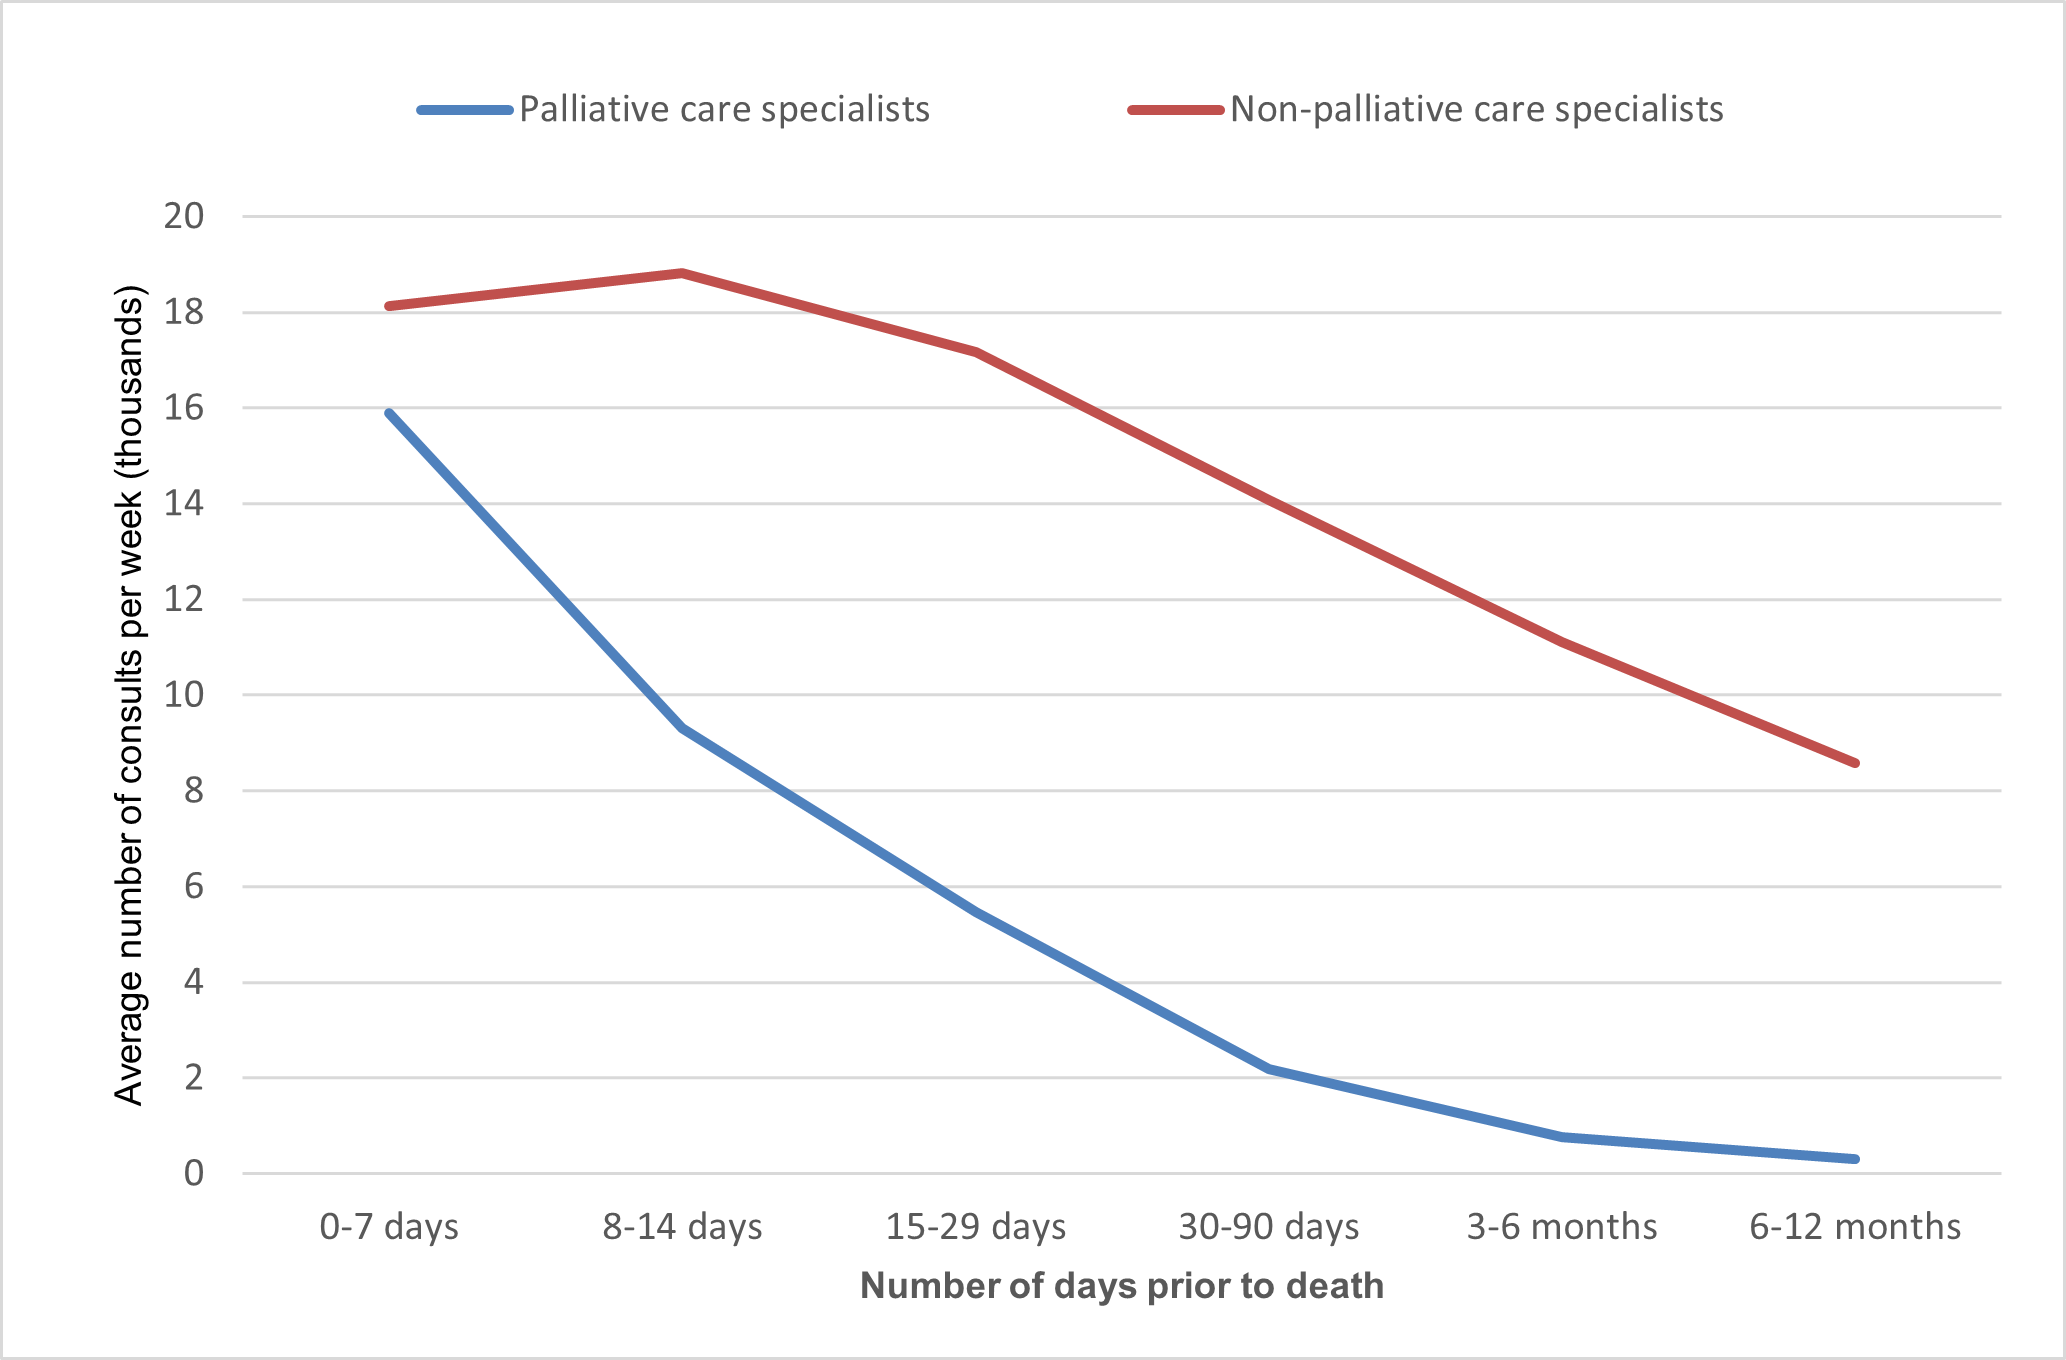
Among SPC, 65% of non-palliative specialist consults occur in the 91–365 days pre-death (3–12 months, broadly), and 13% in the last month (0–29 days) of life. For non-SPC the figures are 60% and 19%, respectively (Supplementary Table 5e). This supports the hypothesis that those not receiving SPC tend to obtain proportionately more of their non-palliative specialist care later in their last year of life, than those receiving SPC. Figure 3.10 shows the raw figures for each of the periods prior to death but when corrected for the duration of each of these periods there is a moderate increase in non-palliative care specialist consultations on a weekly basis and an even greater relative increase in palliative care consultations (Figure 3.10b).
Figure 3.10: Proportion of MBS specialist consultation services in the last year of life, by time intervals before death, for the SPC population
Source: Supplementary Table 5e.
Figure 3.10b: Average number of MBS specialist consultation services (in thousands) per week, in the last year of life, by time intervals before death, for the SPC population
2 in 3 prescriptions were for pain relief, and SPC population more likely to have medications prescribed by specialists
One of the attributes of palliative care is to 'provide relief from pain and other distressing symptoms' (WHO 2020), which in the majority of cases involves prescribing of medications by the treating clinician.
There were 587,608 Pharmaceutical Benefits Scheme (PBS) prescriptions dispensed to 42,506 people in the SPC population in the last year of life, equating to an average of 13.8 prescriptions per person. Less than 1 in 20 (4.7% or 27,667) prescriptions were from the PBS Palliative Care Schedule, provided to 11,161 people in the SPC population. This equates to an average of 2.5 prescriptions per person, considerably lower than the number of prescriptions per person from the Other Schedules (13.3 prescriptions per person, provided to 42,158 people; see Supplementary Tables 7a and 7b).
Note: The General Schedule accounts for 99% of prescriptions included in ‘Other schedules’, with the remainder from the Repatriation Pharmaceutical Benefits Schedule and other schedules (combined due to small counts).
A higher proportion of the SPC population than the non-SPC population had prescriptions dispensed in the last year of life – from all PBS schedules (82% vs 74%), from the Palliative Care Schedule (26% vs 23%) and from all other Schedules (99.2% vs 98.7%).
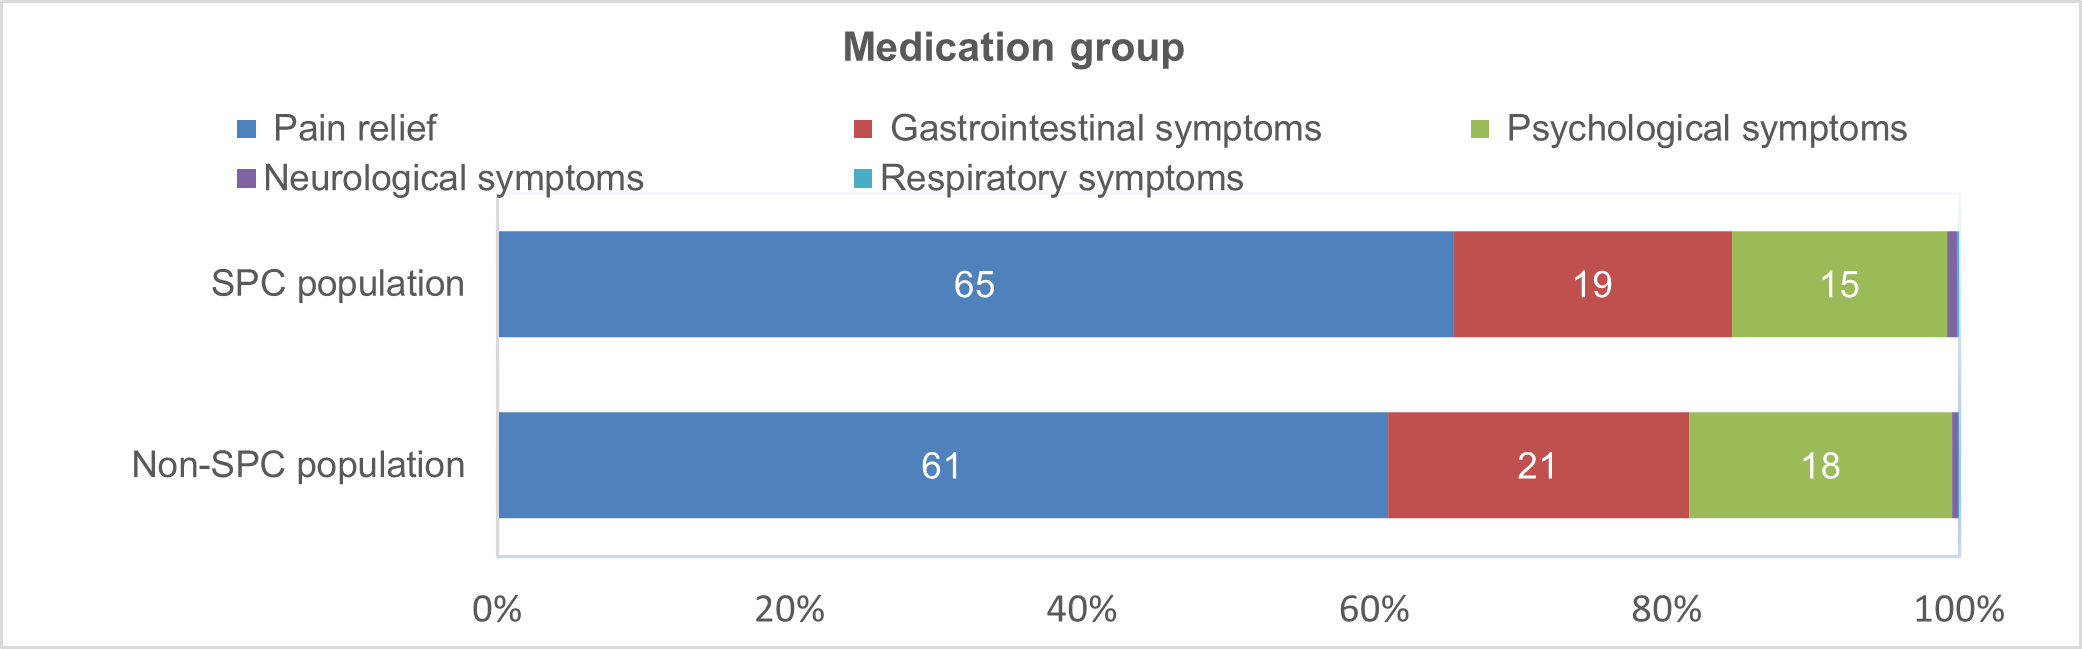
When looking at prescriptions from all PBS Schedules for the SPC population, almost 2 in 3 (65%) were for pain relief, 1 in 5 (19%) for gastrointestinal symptoms, 15% for psychological symptoms and the remaining 0.8% for neurological or respiratory symptoms. As shown in Figure 3.11, these patterns were broadly consistent with the pattern observed for those not receiving SPC.
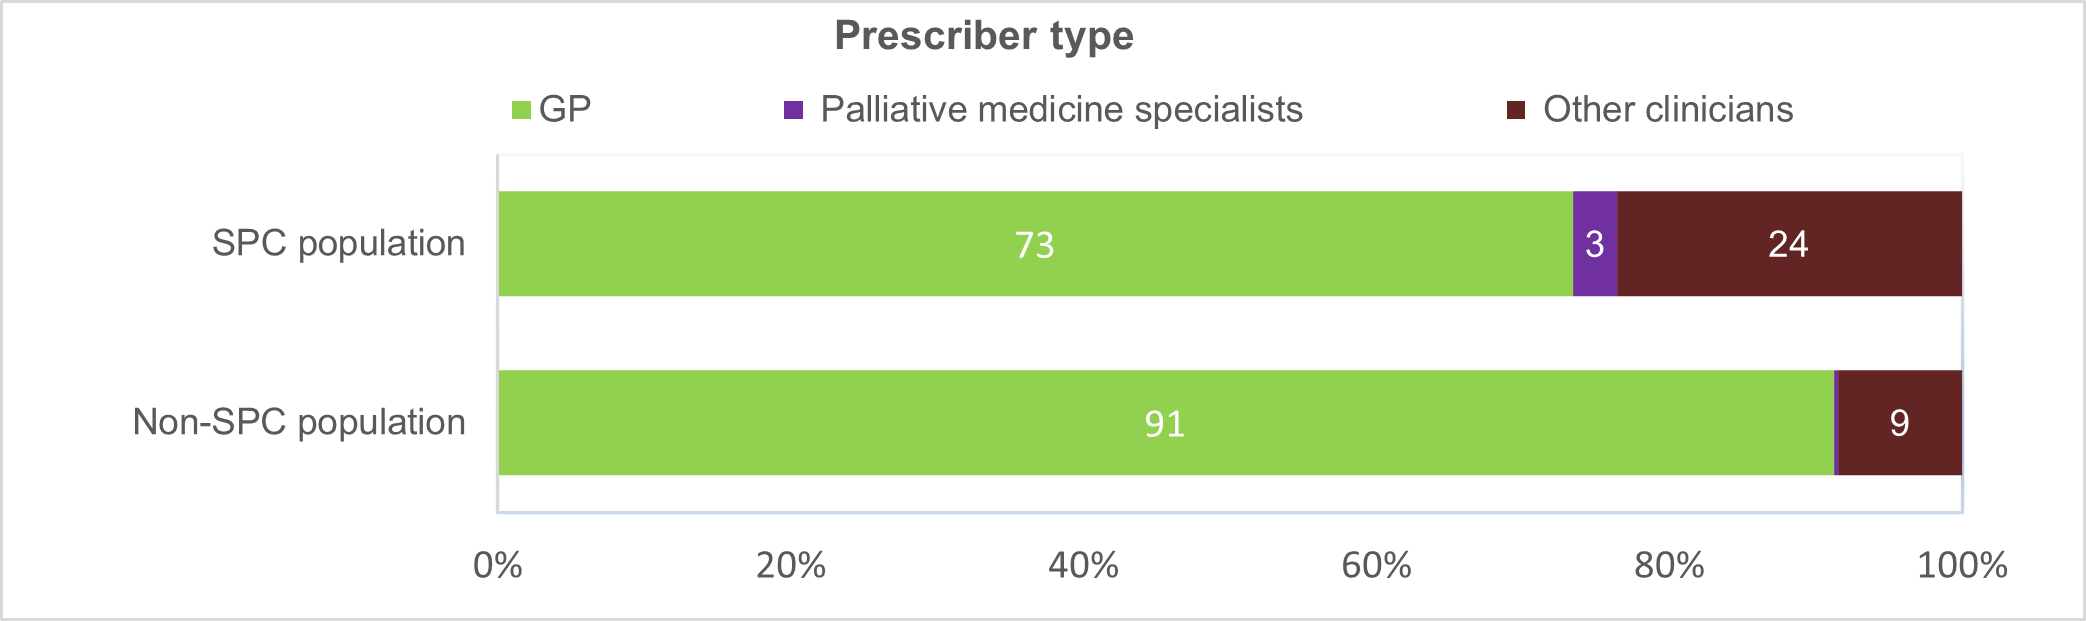
GPs were the largest prescriber of these palliative care symptom prescriptions for the SPC population (73%); however, this was lower than for the population not receiving SPC (91%). This is due to the SPC population being more likely than those not receiving SPC to have medications prescribed by palliative medicine specialists (3.0% vs 0.3%) and by other clinicians (24% vs 8.5%), as shown in Figure 3.11.
The average number of prescriptions per person in the last year of life for the SPC population varies by the palliative care symptom prescriptions, from 11.3 for pain relief, to 4.3 for psychological symptoms to 1.6 for neurological symptoms. Consistent with other analyses of prescribing rates (see AIHW 2023), GPs prescribe on average more medications per person than other clinicians – 11.3 compared with 3.5 for palliative medicine specialists and 5.2 for other clinicians (see Supplementary Tables 7b) presumably associated, in part, to the frequency of consultations.
Figure 3.11: Prescriptions from all PBS Schedules in last year of life, by palliative care symptoms and prescriber type, for SPC and non-SPC populations
Source: Supplementary Table 7b.
SPC population more likely to present to an emergency department and be admitted to hospital than those not receiving SPC
Of the 52,105 people in the predictable deaths population who received SPC in the last year of life (SPC population), almost 9 in 10 (87%) presented to an emergency department in the last year of life (see Supplementary Table 8b). Of these, nearly all (99%) were emergency presentations (as opposed to non-emergency planned reviews or planned admissions). Around 2 in 3 (67%) of these emergency presentations occurred in the month before death – 48% had their last emergency presentation in the 2 weeks before death and 19% between 2-4 weeks before death (Figure 3.12).
Over 9 in 10 (92%) of these emergency presentations resulted in an admission to hospital. The likelihood of this occurring increased when the last emergency presentation was close to death – increasing from 78% when the last emergency presentation was 6–12 months before death to 95% within the last 2 weeks before death (see Supplementary Table 8a). The high rates of admissions may reflect that these ED presentations may not have been easily managed within the community.
The SPC population were more likely to present to the emergency department in the last year of life than those not receiving SPC (87% compared with 65%), and for unplanned presentations (99% vs 97%) and in the last month of life (67% vs 55%). While the likelihood of a hospital admission increased closer to death for SPC population, there was no clear pattern observed for those not receiving SPC with proportions around 72–86% in the last year of life.
Figure 3.12: Distribution of the number of days from last presentation to Emergency Department to death in the last year of life, for SPC and non-SPC populations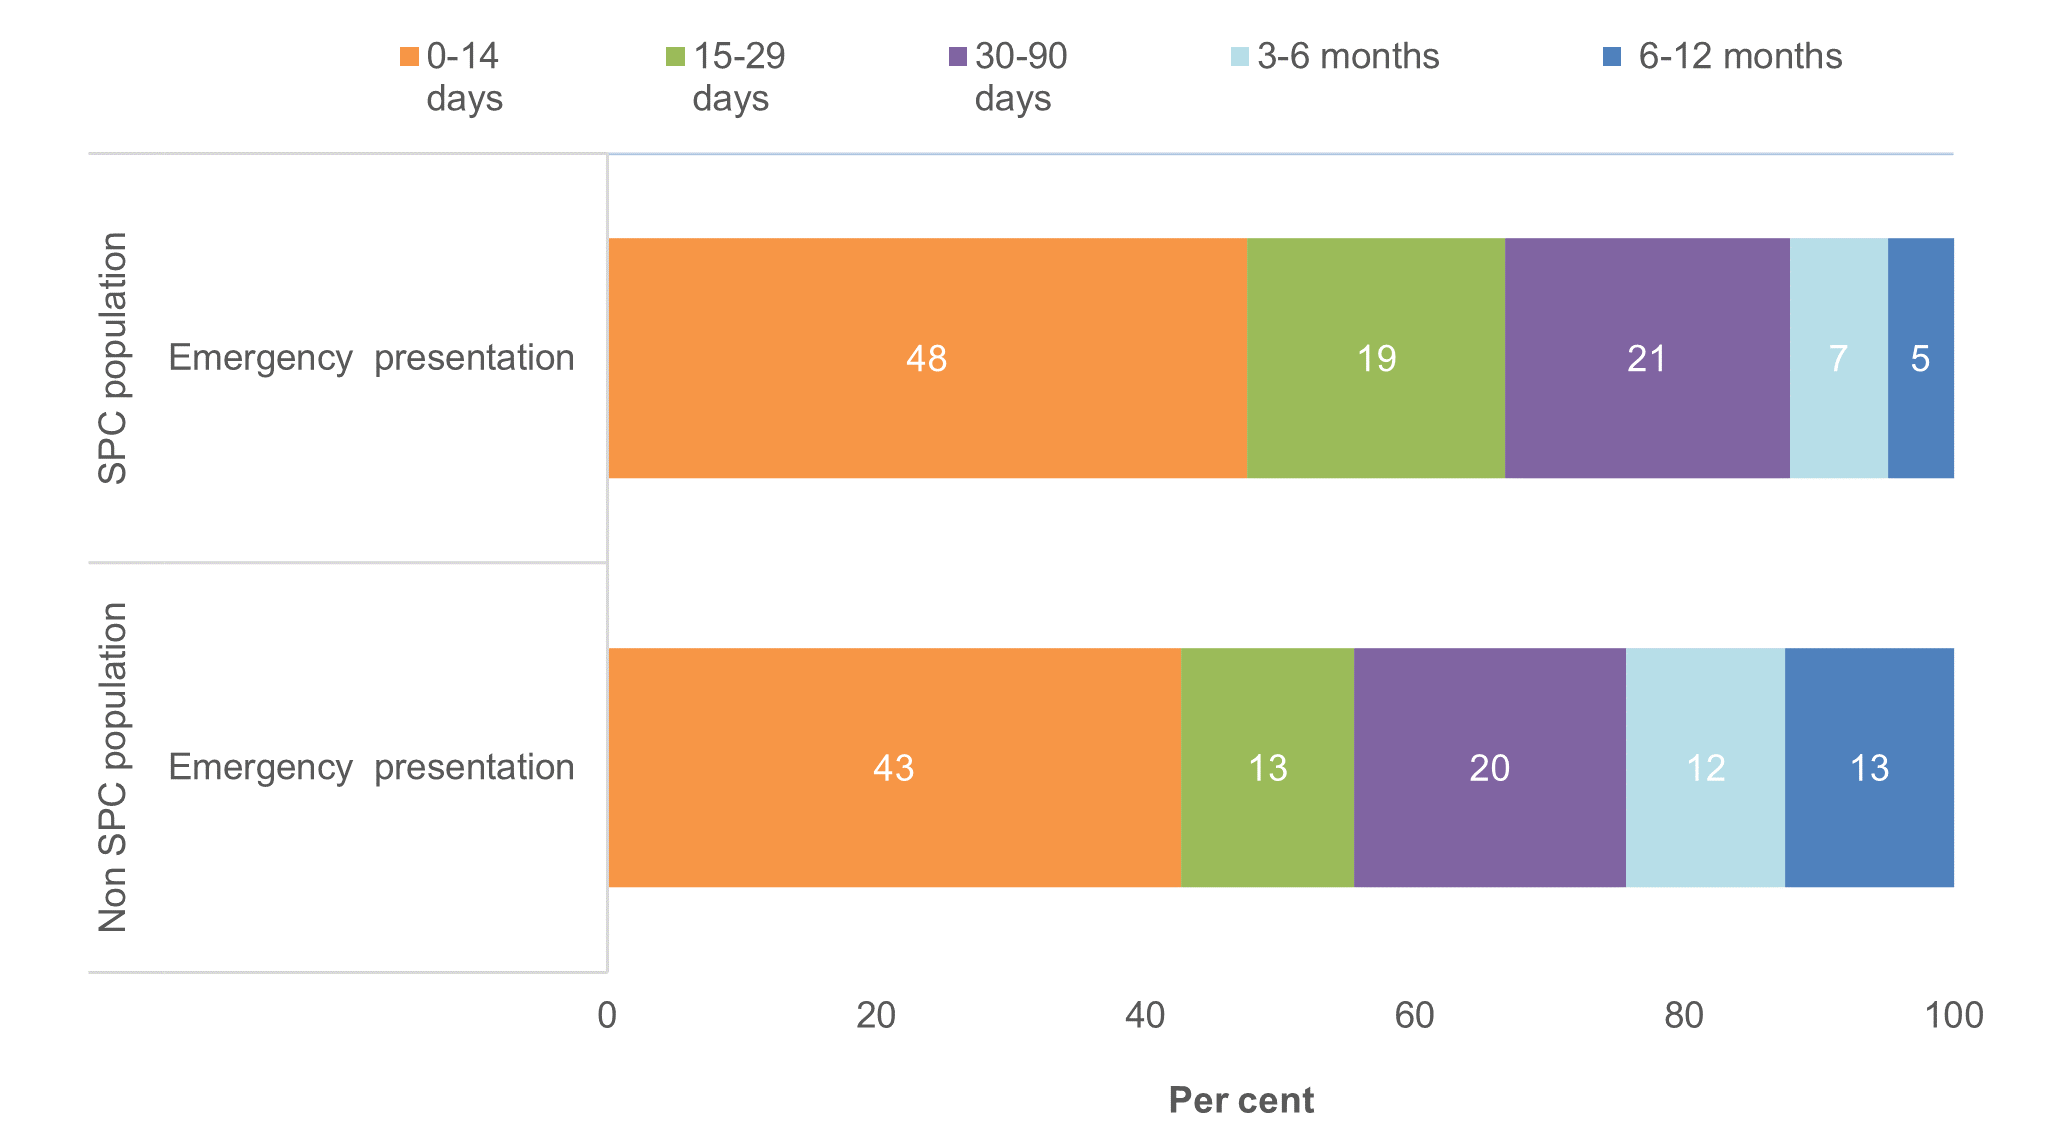
Source: Supplementary Table 8a.