Respiratory conditions
Because of the link between air pollution from bushfire smoke, and respiratory conditions (see Australian bushfires 2019–20: exploring the short-term health impacts), presentations with a principal diagnosis categorised as a respiratory condition (ICD-10-AM codes J00–J99) were analysed.
It should be noted that respiratory conditions, particularly in the earlier part of the bushfire season, may be largely caused or exacerbated by factors other than bushfire smoke (for example, pollen, dust storms, or respiratory infections).
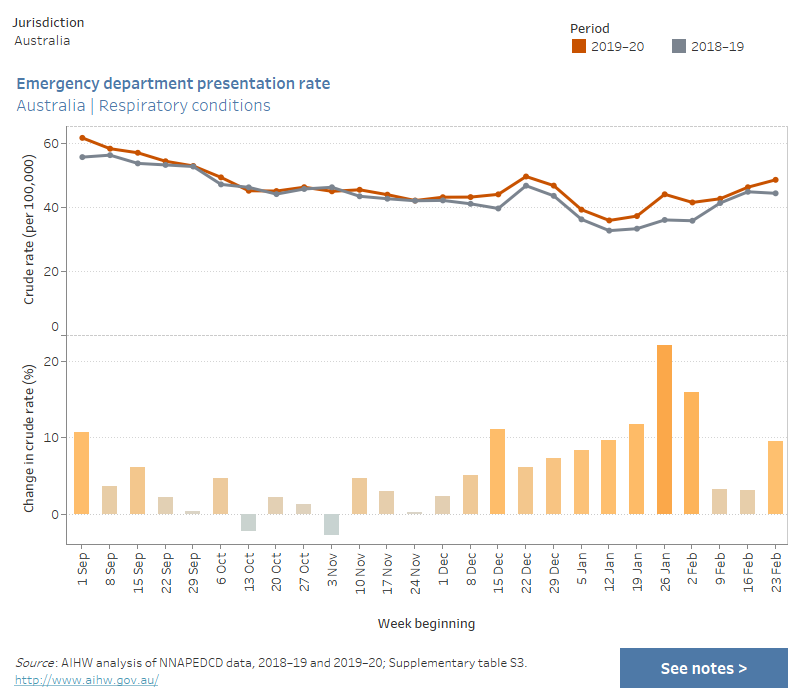
To explore changes in presentations, data from each week in the 2019–20 bushfire season were compared with the same week of the previous year (2018–19). Increases in presentation rates to emergency departments for respiratory conditions were generally higher from mid-November 2019 until the end of February 2020.
Nationally, the largest increase in the presentation rate was 22% in the week beginning 26 January 2020—44 per 100,000 persons (about 11,200 presentations), compared with 36 per 100,000 in the previous bushfire season (about 9,000 presentations). Part of this increase in presentations may have been influenced by the first confirmed case of COVID-19 on 25 January 2020 and associated warnings to self-monitor for respiratory symptoms (Department of Health 2020).
To explore national data and data for states and territories, see interactive data visualisations below (for data tables see Supplementary table S3).
Emergency department presentation rate, by jurisdiction, respiratory conditions (ICD-10-AM codes J00–J99), weeks in 2019–20 bushfire season relative to previous year
This combined chart shows the crude rate of emergency department presentations (per 100,000 persons) for respiratory conditions for the periods 2019–20 and 2018–19, and the percentage change in crude rate between the two periods. Data are presented by jurisdiction and by week, for the period 1 September to 29 February/1 March, which correspond to the bushfire season. The chart shows that nationally, compared with the previous year, the largest increase in the presentation rate was 22% in the week beginning 26 January 2020. There were also variations at the jurisdictional level.

The Australian Capital Territory was an example in which there was a large increase in the presentation rate for respiratory conditions coinciding with periods of significant fire activity or air pollution. A 58% increase was observed in the week beginning 5 January 2020—50 per 100,000 persons (about 210 presentations), compared with 31 per 100,000 in the previous bushfire season (about 130 presentations).
At the level of Statistical Area Level 4 (SA4), examples of large increases in the presentation rate for respiratory conditions coinciding with periods of significant fire activity or air pollution include:
- increases ranging from 21% to 83% in the weeks between 15 December 2019 and 18 January 2020 for Riverina residents, compared with the previous bushfire season. Each of these weeks featured PM2.5 measurements rated as ‘extremely poor’ at the Wagga Wagga air quality monitoring station within this SA4.
- an 85% increase in the week beginning 5 January 2020 for Capital Region residents—about 105 per 100,000 persons (about 245 presentations), compared with 57 per 100,000 in the previous bushfire season (130 presentations). An increase of 55% was also observed in the week beginning 29 December 2019. This coincided with the intense bushfire activity in the area from Batemans Bay, New South Wales, in the north, down to Eden near the Victorian border.
- notable increases in the Australian Capital Territory that coincided with weeks of poor air quality due to bushfire smoke, particularly around the 2019–20 Christmas and New Year period.
For data by Statistical Area Level 4 (SA4), see Supplementary table S4.
References
Department of Health 2020. First confirmed case of novel coronavirus in Australia. Viewed 7 July 2021.


