Chronic obstructive pulmonary disease with acute exacerbation
Chronic obstructive pulmonary disease with acute exacerbation, henceforth referred to as COPD, has been found to increase in association with air pollution from bushfire smoke (see Australian bushfires 2019–20: exploring the short-term health impacts); therefore, while COPD was included within all respiratory conditions, emergency department presentations with a principal diagnosis of COPD with acute exacerbation (ICD-10-AM code J44.1) were also analysed separately. The current chapter reports the presentation rate of COPD for all ages. While COPD can be reported in younger age groups, the diagnosis of the condition is more certain for those aged 45 and over.
Nationally, there were increases in presentations for COPD from 3 November 2019 to the end of February 2020. There was a large increase in the presentation rate of 31% in the week beginning 12 January 2020—1.4 per 100,000 persons (about 365 presentations), compared with 1.1 per 100,000 in the previous bushfire season (about 275 presentations).
To explore national data and data for states and territories, see interactive data visualisations below (for data tables see Supplementary table S3).
Emergency department presentation rate, by jurisdiction, COPD (ICD-10-AM code J44.1), weeks in 2019–20 bushfire season relative to previous year
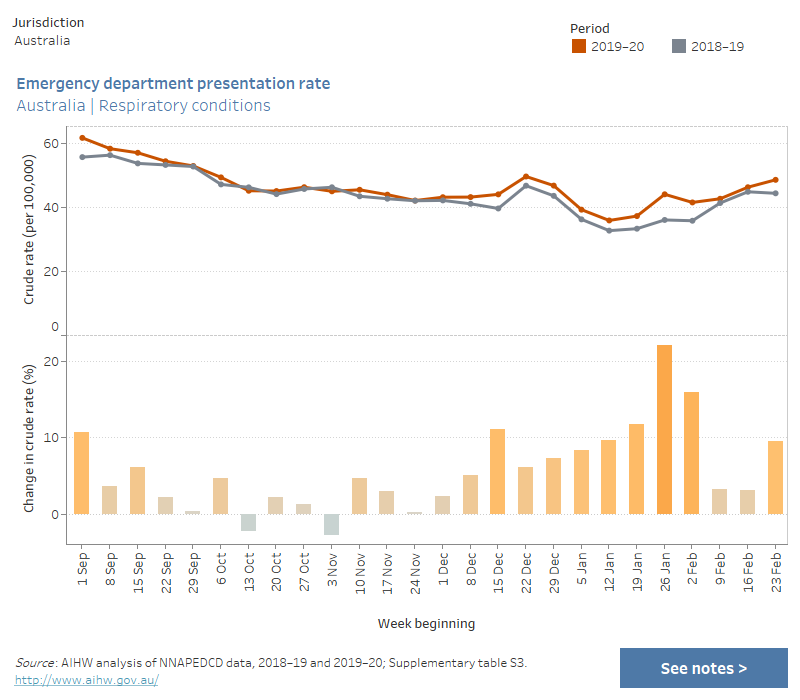
This combined chart shows the crude rate of emergency department presentations (per 100,000 persons) for Chronic obstructive pulmonary disease (COPD) with acute exacerbation for the periods 2019–20 and 2018–19, and the percentage change in crude rate between the two periods. Data are presented by jurisdiction and by week, for the period 1 September to 29 February/1 March, which correspond to the bushfire season. The chart shows that nationally, compared with the previous year, there were increases in the presentation rate from 3 November 2019 to the end of February 2020. There were also variations at the jurisdictional level.

At the state and territory level, examples of large increases in the presentation rate for COPD coinciding with periods of significant fire activity or air pollution included:
- a 21% to 65% increase in the weeks beginning 1 December 2019 to 8 February 2020 for New South Wales residents. The highest increase was 65% in the week beginning 12 January 2020—2.3 per 100,000 persons (about 185 presentations), compared with 1.4 per 100,000 in the previous bushfire season (about 110 presentations)
- a 29% increase in the week beginning 10 November 2019 for Queensland residents—2.3 per 100,000 persons (115 presentations), compared with 1.8 per 100,000 (88 presentations). This increase corresponded to a week in which Queensland experienced particularly high levels of air pollution from bushfire smoke.
Because the numbers of COPD ED presentations at the level of Statistical Area Level 4 (SA4) were generally small, data are not presented at this level.
For data by Statistical Area Level 4 (SA4), see Supplementary table S4.


