Breathing difficulties (abnormalities of breathing)
Emergency department presentations with a principal diagnosis relating to abnormalities of breathing (R06.0–R06.8), henceforth referred to as breathing difficulties, were analysed due to the association between bushfire smoke pollution and respiratory symptoms (see Australian bushfires 2019–20: exploring the short-term health impacts).
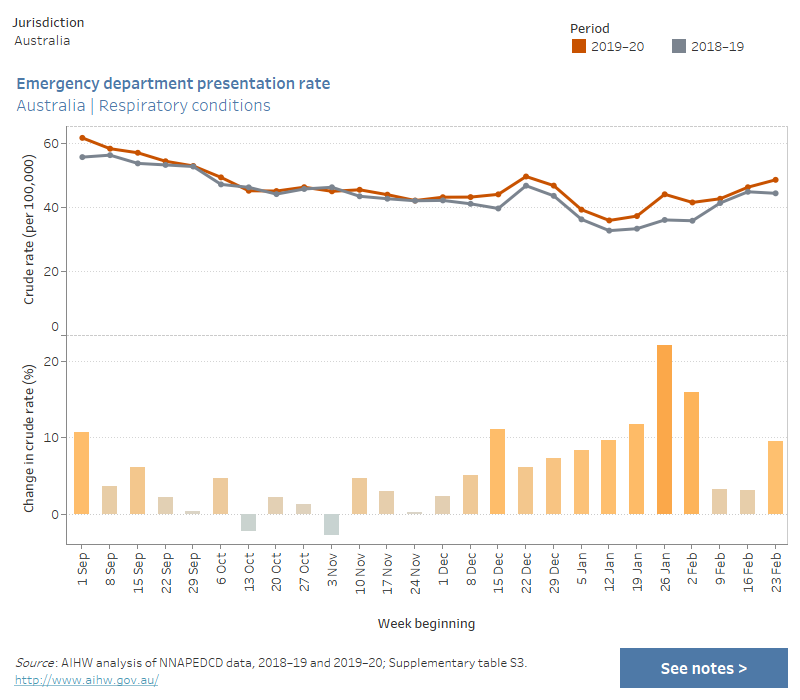
Nationally, there were increases in presentations for breathing difficulties throughout most of the 2019–20 bushfire season, with the largest increases occurring between the week beginning 5 January 2020 and the week beginning 19 January 2020. The largest increase in presentation rate was 21% in the week beginning 19 January 2020—6.8 per 100,000 persons (about 1,700 presentations), compared with 5.6 per 100,000 in the previous bushfire season (about 1,400 presentations).
To explore national data and data for states and territories, see interactive data visualisations below (for data tables see Supplementary table S3).
Emergency department presentation rate, by jurisdiction, breathing difficulties (ICD-10-AM code R06.0–R06.8), weeks in 2019–20 bushfire season relative to previous year
This combined chart shows the crude rate of emergency department presentations (per 100,000 persons) for breathing difficulties for the periods 2019–20 and 2018–19, and the percentage change in crude rate between the two periods. Data are presented by jurisdiction and by week, for the period 1 September to 29 February/1 March, which correspond to the bushfire season. The chart shows that nationally, compared with the previous year, there were increases in the presentation rate throughout most of the 2019–20 bushfire season, with the largest increases occurring between the week beginning 5 January 2020 and the week beginning 19 January 2020. There were also variations at the jurisdictional level.

At the state and territory level, examples of large increases in the presentation rate for breathing difficulties coinciding with periods of significant fire activity or air pollution included:
- a 60% increase in the week beginning 12 January 2020 for Victorian residents—7.0 per 100,000 persons (460 presentations), compared with 4.4 per 100,000 in the previous bushfire season (about 280 presentations). A similar increase was observed in the week beginning 5 January 2020
- around a 155% increase in the week beginning 5 January 2020 for Australian Capital Territory residents—8.4 per 100,000 persons (36 presentations), compared with 3.3 per 100,000 in the previous bushfire season (14 presentations).
Numbers of presentations for breathing difficulties at the level of Statistical Area Level 4 (SA4) were generally small and should be considered with caution. However, some notable examples of increases include:
- an increase of around 155% in the week beginning 5 January 2020 for Capital Region residents—13 per 100,000 persons (31 presentations), compared with 5.3 per 100,000 (12 presentations). The week before this recorded around a 120% increase, with the presentation rate reaching 20 per 100,000 (47 presentations) compared with 9.2 per 100,00 (21 presentations)
- a 79% increase in the week beginning 3 November 2019 for Perth-South West residents—11 per 100,000 persons (49 presentations), compared with 6.3 per 100,000 in the previous bushfire season (27 presentations). There were increases of 37%, 26% and 31% during the remaining weeks of November 2019. This corresponded to a time when bushfires burned at an Emergency warning level.
For data by Statistical Area Level 4 (SA4), see Supplementary table S4.


