Where did falls occur?
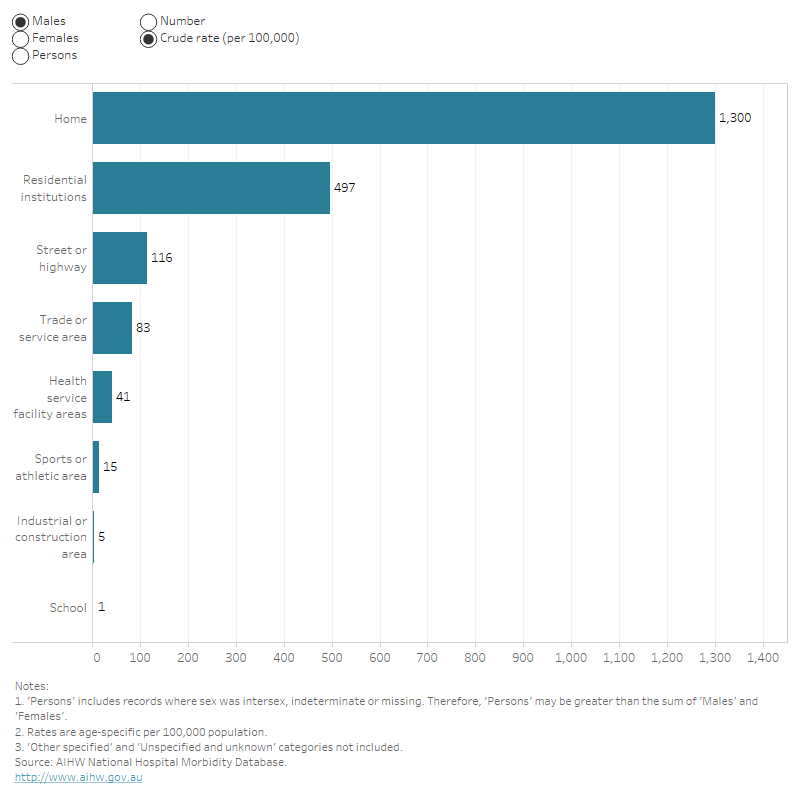
Most hospitalised falls among people aged 65 and over occurred at home (53%), with residential aged care facilities being the next most reported fall location (21%) (Table 9). Note that these data are likely to be underestimates, as 14% of hospitalisations recorded an unspecified or unknown place of occurrence.
Deaths data are not presented by fall location due to the large number of records with missing or unspecified location data.
|
Place of occurrence |
Number |
% |
Crude rate (per 100,000) |
|---|---|---|---|
|
Outdoor areas (Y92.01) |
11,466 |
8.7 |
278 |
|
Bathroom (Y92.03) |
8,560 |
6.4 |
208 |
|
Indoor living areas NEC (Y92.07) |
7,161 |
5.4 |
174 |
|
Bedroom (Y92.05) |
6,989 |
5.3 |
170 |
|
Kitchen (Y92.04) |
5,044 |
3.8 |
123 |
|
Driveway to home (Y92.00) |
1,727 |
1.3 |
42 |
|
Garage (Y92.02) |
1,028 |
0.8 |
25 |
|
Laundry (Y92.06) |
447 |
0.3 |
11 |
|
Other and unspecified place in the home (Y92.09) |
27,446 |
21 |
667 |
|
Home (Y92.0) |
69,868 |
53 |
1,697 |
|
Aged care facilities (Y92.14) |
27,947 |
21 |
679 |
|
Other and unspecified residential institutions (Y92.10–Y92.13; Y92.15–19) |
292 |
0.2 |
7.1 |
|
Residential institutions (Y92.1) |
28,239 |
21 |
686 |
|
Street or highway (Y92.4) |
5,479 |
4.1 |
133 |
|
Trade or service area (Y92.5) |
4,279 |
3.2 |
104 |
|
Other specified area (Y92.8) |
3,027 |
2.3 |
74 |
|
Health service facility areas (Y92.23–24) |
1,999 |
1.5 |
49 |
|
Sports or athletics area (Y92.3) |
647 |
0.5 |
16 |
|
Industrial or construction area (Y92.6) |
106 |
0.1 |
2.6 |
|
School (Y92.21) |
52 |
0.0 |
1.3 |
|
Unspecified or Unknown (Y92.9) |
19,237 |
14 |
467 |
|
Total |
132,933 |
100 |
3,228 |
NEC Not elsewhere classified.
Notes
- Percentages may not tally to 100 due to rounding.
- Codes in brackets refer to the ICD–10-AM (11th edition) external cause codes (ACCD 2017).
Source: AIHW National Hospital Morbidity Database.
For more detailed data, see Data tables A16–21.
Figure 8: Top specified locations for falls hospitalisations by sex, 65 years and over, 2019–20
Bar graph showing falls in the home followed by residential institutions had the highest number and rate of fall hospitalisations. Residential institutions had the highest number and rate of fall deaths for both males and females.

For more detailed data, see Data tables A16–17.
Falls in the home
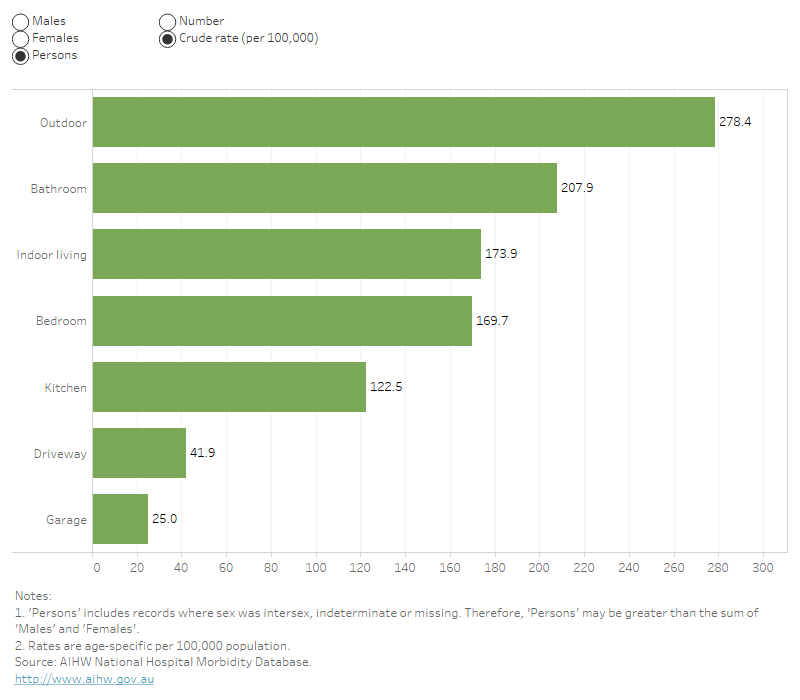
In 2019–20, among the almost 70,000 older Australians whose hospitalisation was caused by a fall in the home, outdoor areas (11,500) and bathrooms (8,600) were the most common locations of falls.
Differences between the sexes in hospitalisations caused by a fall in the home (Figure 9) included that:
- females were 2.3 times as likely to be hospitalised due to a fall in the kitchen than males (crude rate of 166 and 73 cases per 100,000, respectively)
- males were 1.5 times as likely to be hospitalised due to a fall in the garage than females (crude rate of 31 and 20 cases per 100,000, respectively).
Figure 9: Hospitalised falls at home by place of occurrence, 65 years and over, 2019–2020
Bar graph showing that outdoor areas followed by bathroom and indoor living areas were the most common hospitalised fall location at home for both males and females.

For more detailed data, see Data tables A18-19.
Falls in residential aged care facilities
In 2019–20, there were 27,900 hospitalisations due to falls that occurred in a residential aged care (RAC) facility among people aged 65 and over, at a rate of 679 hospitalisations per 100,000 people aged 65 and over (Table 9). The definition of an RAC facility used in this report is from the ICD-10-AM and includes nursing homes and retirement villages. Two-thirds (18,500) of hospitalised falls in RAC facilities were for females. Rates increased markedly with age, from 53 hospitalisations per 100,000 for 65–69 year olds to 6,905 per 100,000 for people aged 95 and over.
These rates are per the Australian population aged 65 and over. Another meaningful statistic would be the rate of hospitalised falls among people living in RAC. However due to differences in the classification of residential aged care facilities as a place of occurrence in the hospitalisations data used in this report and available national estimates of the residential aged care population (for example, that used in the AIHW's GEN data (2021f), it is not possible to report the rate of falls hospitalisations within the RAC population here.


