What were the impacts of COVID-19?
The second half of the 2019–20 reporting period coincided with the beginning of the COVID–19 pandemic in Australia. The social restrictions and behaviour changes associated with the COVID-19 pandemic impacted the number and type of fall hospitalisations and deaths. For example, in April 2020 in Victoria all types of emergency department presentations were 32% lower compared to the same month in 2019 (VISU 2020).
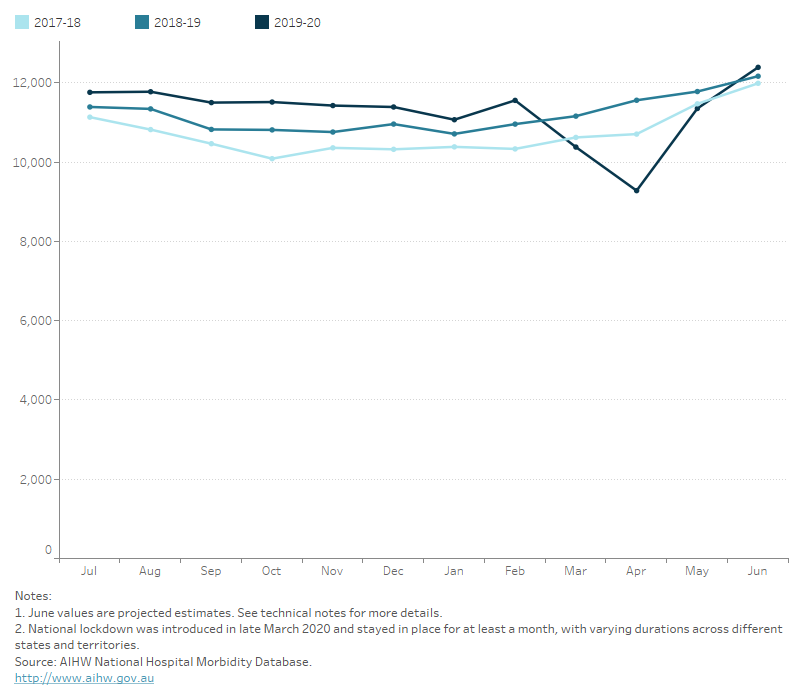
National data show that in April 2020 among people aged 65 and over there were 25% fewer fall hospitalisations than the same month the previous year. However, by June 2020, with the easing of COVID-19-related restrictions, hospital admissions for fall-related injuries had returned to pre-pandemic levels (Figure 16).
In the following chapter, the data for June are based on projected estimates, see technical notes for more details.
Figure 16: Number of hospitalisations and deaths due to falls by month, 65 years and over, 2017–18 to 2019–20
Line graph showing that over 2019–20 the number of fall hospitalisations was comparable to previous years, however from March to May there is a marked decrease in hospitalisations coinciding with the COVID-19 pandemic. There was a slight decrease fall related deaths of April 2019–20; however, a marked decrease is seen annually in fall deaths from December to January.

For more detailed data, see Data tables A46–47 and B19.
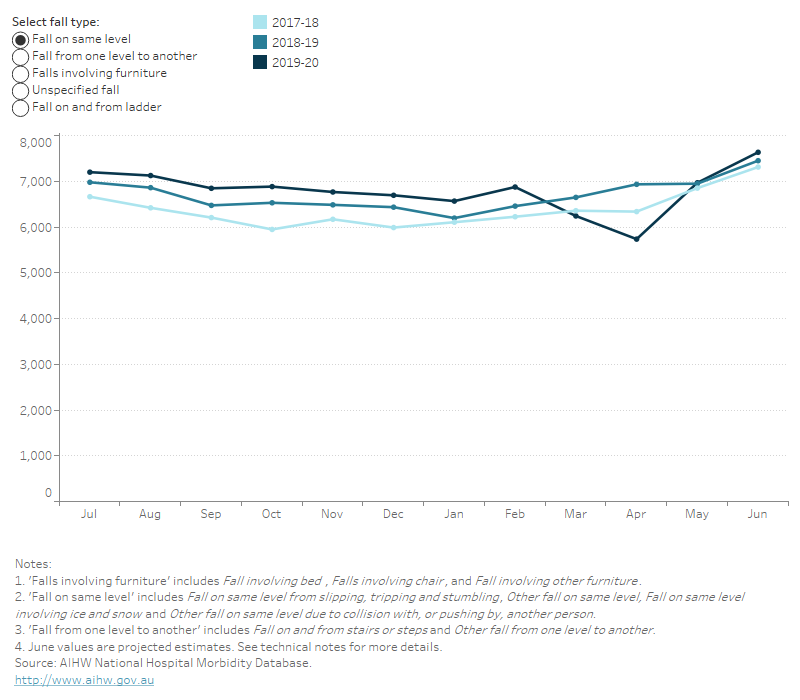
There were differences in the types of falls during this period compared to the same period in previous years (Figure 17). Compared to data from April 2018–19, hospitalisations for:
- falls from one level to another (includes stairs and steps) decreased by 17% (860 in 2018–19 to 580 in 2019–20)
- falls on or from a ladder increased by 7.8% (230 in 2018–19 to 250 in 2019–20).
Figure 17: Number of hospitalised falls by month and type of fall, 65 years and over, 2017–18 to 2019–20
Line graph showing that most fall types observed a decrease in March to April in 2019–20 compared to previous years, hospitalised falls from a ladder was the only category where hospitalisations increased in 2019–20.

For more detailed data, see Data tables A48.
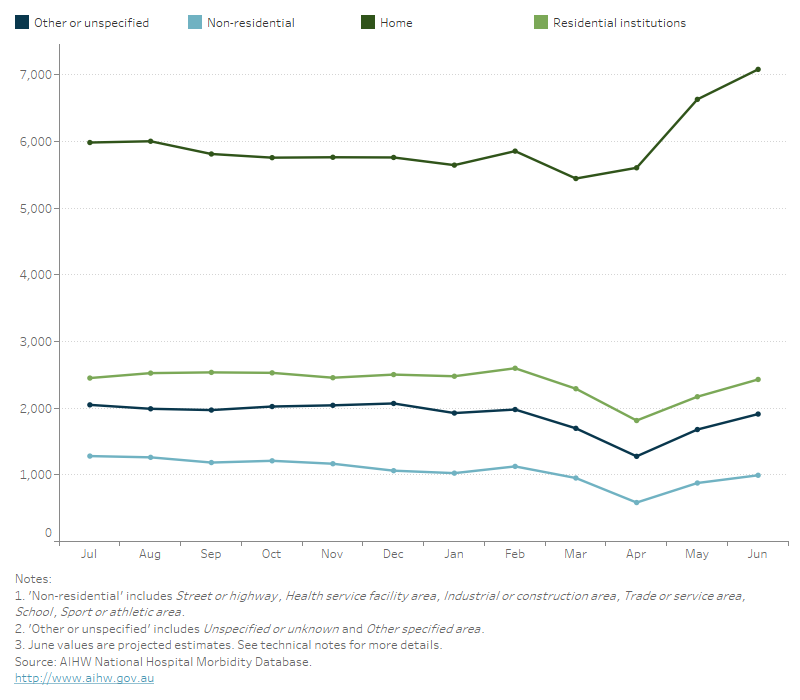
There were notable differences in the data for where falls occurred during this time compared to the previous year (Figure 18). Compared to data from April 2018–19, hospitalisations for:
- falls in non-residential settings (Health service facility, Industrial or construction area, School, Sports or athletic area, Street or highway, and Trade or service areas) decreased by 54% (1,300 in 2018–19 to 580 in 2019–20)
- falls in 'Residential institutions' decreased by 28% (2,500 in 2018–19 to 1,800 in 2019–20)
- falls at 'Home' decreased by 2.7% (5,800 in 2018–19 to 5,600 in 2019–20), much less than the 25% decrease in overall falls hospitalisations.
In May and June of 2020, falls at home increased by about 10% from the previous reporting year. This increase in falls at home exceeded the pre-pandemic number of falls at home.
Figure 18: Number of hospitalised falls by month and location, 65 years and over, 2017–18 to 2019–20
Line graph showing that all locations observed a decrease in number of falls over March to April in 2019–20 compared to previous year, hospitalised falls in the home has the least variation by year.

For more detailed data, see Data tables A49.
In 2019–20 the COVID-19 pandemic led to a reduction in hospitalisations due to falls across all locations in April, with falls in the home the least affected location (Figure 19). In May and June of 2020, the number of falls increased across all locations; however, falls in the home increased beyond pre-pandemic numbers.
Figure 19: Number of hospitalised falls by month and place of occurrence, 65 years and over, 2019–20
Line graph showing that in 2019–20 falls resulting in hospitalisation commonly occurred in the home. All fall locations observed a decrease in in number of falls from March to May coinciding with the COVID-19 pandemic.

For more detailed data, see Data tables A49.


