Key factors associated with tenant satisfaction

As noted in the first chapter of this report, over two-thirds of social housing tenants (69%) were satisfied with the overall services provided by their housing organisation in 2023 (see Figure Satisfaction.1, Table S1.1). However, the underlying reasons why tenants were satisfied – or dissatisfied – are relative to their lived experience of social housing (Pawson and Sosenko 2011). The pathways from living in social housing to being satisfied with living in social housing are as diverse as individual experiences of social housing (Garnham et al. 2021).

To better understand the Australian social housing experience, a range of aspects of the 2023 NSHS were examined using regression analysis. The goal of the following analyses was to identify which factors were related to tenant satisfaction, both within and between social housing programs. 

Understanding regression and differences in tenant satisfaction

Regression analysis is a statistical technique used to understand relationships among multiple variables. It examines the strength of the relationship between the specified factors and an outcome (such as tenant satisfaction), while holding other factors equal. Here, a logistic regression analysis was used to determine the relationships between multiple ‘factors’ (such as tenant age, location or condition of the dwelling) and tenant satisfaction. 

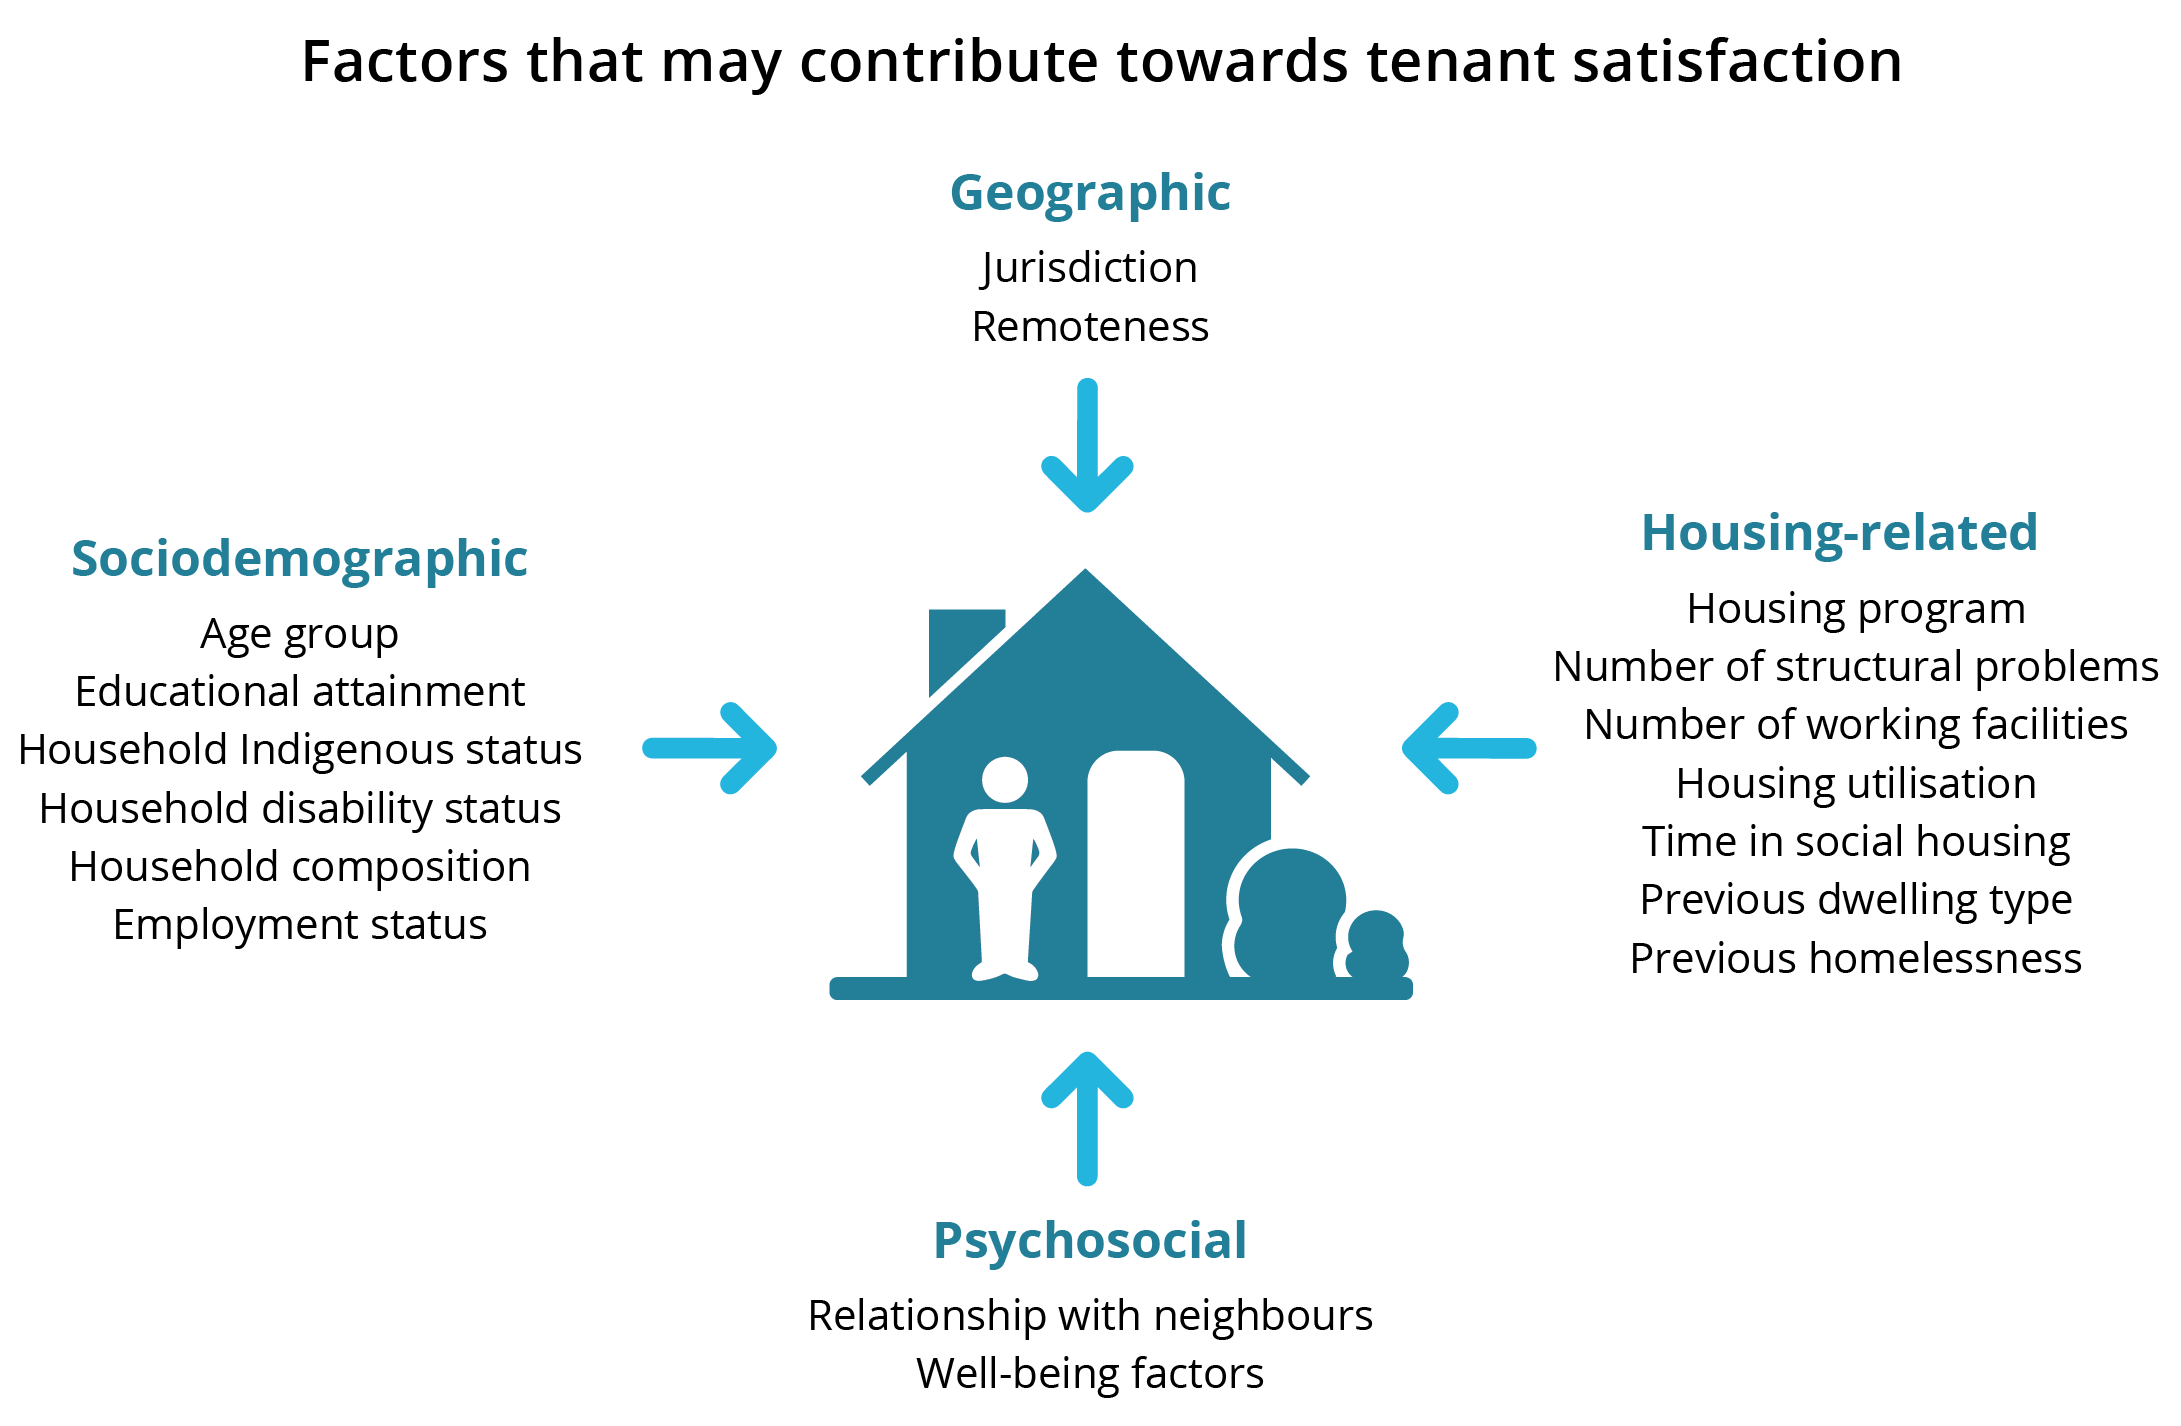
The regression model included key geographic, psychosocial, sociodemographic and housing-related factors. Although other factors (such as tenants’ housing expectations) likely contribute to tenant satisfaction, only the directly measurable aspects of social housing were included as factors to maintain direct relevance to social housing performance.

Identifying key factors in tenant satisfaction using logistic regression analysis

Logistic regression analysis is a way to examine relationships between multiple factors (for example, social housing program, location and condition) with an outcome (such as tenant satisfaction). This statistical technique shows which individual factors are significantly associated with tenant satisfaction, after accounting for other factors included in the model (see, for example, Sperandei 2014); or in other words, when all else is equal between tenants. Using NSHS data, a regression model for tenant satisfaction (illustrated below) was developed to include housing-related, geographic, psychosocial and sociodemographic factors.

Image is of a stylised house surround by a list of the geographic, sociodemographic, psychosocial and housing-related factors that were included in the regression model.

The regression model is used to explore how likely it is that a tenant with a particular set of characteristics would be satisfied with their housing services. The value of the technique is that it allows comparisons of the ‘predicted probabilities’ for 2 tenant groups that differ by a single characteristic, when all else is equal (or held constant). If the model identifies a statistically significant difference, this suggests there could be a relationship between the factor in question and tenant satisfaction – a relationship that holds after accounting for all factors included in the model. 

To create a point of reference, a base case is assigned for each variable in the model so that the direction and size of a factor’s relationship with satisfaction can be seen. See Table C1 for the categories and base cases for all factors in the model. The reference group is a hypothetical group of tenants with all the base case characteristics combined. This provides a point of reference only and does not affect the findings. All estimates (such as predicted probabilities) presented in this report are in reference to the base case. See the technical notes for a detailed description of the base case.  

The base case for each variable were chosen because they provide a useful point of reference. For example, they were the bottom or top of a variable range (for example, age group); they represented the most common group (for example, public housing); or they appear to have higher satisfaction levels (for example, Queensland).

This report presents the predicted probability of satisfaction for tenants in the reference group and shows how predicted satisfaction changes for tenants who differ on just one characteristic. For example, in the section on dwelling condition, the likelihood of being satisfied for tenants with structural problems is compared with those with no structural problems (the base case), while accounting for other factors. Predicted probabilities are presented as percentages but differ from the descriptive proportions included elsewhere in this report. 

The technical notes present detailed information about the regression method and results.

Tips on interpreting regression results

Statistically significant results are when differences in results between groups or associations between a factor and result met a required statistical benchmark of confidence. Throughout this report, the term ‘significantly’ refers to statistically significant. More information on understanding significance is outlined in the introduction. 

Factors significantly associated with tenant satisfaction

There are a range of factors that were significantly associated with tenant satisfaction for all social housing tenants and among tenants of the 3 social housing programs surveyed in 2023 (Figure Factors.1, Table R.2). Some factors were not statistically significant for social housing tenants collectively but were statistically significant for tenants within specific social housing programs. 

Figure Factors.1. Summary of factors associated with tenant satisfaction, by social housing program, 2023

This interactive table shows which factors were significantly associated with tenant satisfaction for each of the housing programs. In 2023 across all programs and states/territories, the number of structural problems, level of comfort asking a neighbour for help and high level of worry or anxiety were all highly significant. 

Only those results for factors that were significant among all social housing tenants are presented in this section. Also, only when a factor was found to be significant among all social housing programs, are the results for tenants within each of the specific programs presented. The results for the non-significant factors and those unique to specific programs can be found in the supplementary tables.

Housing conditions that affect tenant satisfaction

Housing conditions relate to the physical characteristics and quality of the dwelling, such as its structure, facilities and amenities. Whether a home is structurally sound and has access to working facilities is a key aspect of any housing experience, as it has the potential to influence multiple aspects of health and wellbeing, such as respiratory health and mental health (Baker et al. 2016; Clapham et al. 2017; Fujiwara 2013). In 2019–20, the Australian Bureau of Statistics (ABS) reported that renters from state and territory housing authorities accounted for the highest proportion of households reporting major structural problems (ABS 2020).   

Likewise, whether a home is appropriate for a person’s household size is another key aspect of the housing experience, as it can also influence multiple aspects of tenants’ wellbeing, such as their sense of space and privacy (Dockery et al. 2022).

Structural problems affect tenant satisfaction

NSHS question about structural problems

NSHS respondents were asked if their home had any of the following problems:

  • Major electrical problems
  • Major plumbing problems
  • Major cracks in walls/floors
  • Walls/windows not square (out of alignment)
  • Wood rot / termite damage
  • Sinking/moving foundations
  • Sagging floors
  • Major roof problems
  • Rising damp
  • Other structural problems

For both 2021 and 2023, structural problems were a highly significant factor in tenant satisfaction. The more structural problems a tenant had with their social housing dwelling, the less likely the tenant will be satisfied (Figure Factors.2, Table R.2). Within each housing program, tenants living in a dwelling with one or more structural problems were less likely to be satisfied than those without, when all other factors were considered equal. 

‘I'm still waiting for repairs to be done on my bathroom (hole in tiles from a maintenance worker standing on them, no ventilation causing mould), fly screens to be installed in my lounge-room (can't use the window ‘cause there's a wasp nest outside it), holes in walls to be patched up, and a gas heater to be removed since it's not ventilated. I've sent multiple emails and have heard nothing back.’ 

‘Short Term Services – satisfied that basic items are inspected every year. e.g. safety switches. There are services to provide day-to-day support for plumbing, electrical and gas infrastructure. Medium Term Services – satisfied there was a program this year to replace water meters.’ 

‘I have lived in this house for 38 years. In all this time my house has been painted once, my carpet is disgustingly old, my laundry never had any renovations or updates - no cupboards only a sink. It was supposed to be renovated back in 2014 - I'm still waiting. I don't have a security screen door; living alone I find it not very secure.'

Figure Factors.2: Predicted probability (%) of being satisfied with the overall service provided by their housing organisation, by the number of structural problems and social housing program, 2023

This interactive bar chart shows that tenant satisfaction (predicted probability) decreased with an increasing number of structural problems. This trend was consistent across housing programs and states and territories. 

‘Failure of Housing to respond to water flooding and significant water damage to fixtures, walls and floors.’ 

‘It's almost impossible to get ‘non-urgent’ maintenance done. I have had water leaking into and mould patches on the ceiling in my bedroom since I moved in over 12 years ago. At least a dozen attempts to fix it have failed. It took 6-7 years to get moth-riddled carpet replaced. My back fence has collapsed into my courtyard – still waiting for that to be repaired. All the units in our complex have had rusted and leaking gutters for years. The outside of the units have been slowly eaten away by termites/wood rot over many years. Paths around the units are uneven due to tree roots lifting them. Units are not secure – window locks are rusted and don't work.’ 

Access to working facilities affects tenant satisfaction

Access to working facilities – such as cooking facilities, a refrigerator, bath or shower, toilet, a washing machine, kitchen sink and laundry tub – is a key aspect of housing condition that may affect tenant satisfaction (Hu et al. 2022). Tenants were asked whether they had access to 7 different working facilities in their social housing dwelling. Note that the following findings do not differentiate between facilities that are the ownership or responsibility of the housing organisation or tenant.

When all else was considered equal, tenants with access to 6 or fewer working facilities were significantly less likely to be satisfied than tenants that had access to all 7 facilities. This was true for all housing types. 

Figure Factors.3: Predicted probability (%) of being satisfied with the overall service provided by an organisation, by the number of working facilities and social housing program, 2023

This interactive bar chart shows that tenant satisfaction (predicted probability) was significantly lower when there were fewer than 7 working facilities. This trend was consistent across housing programs. 

 ‘Poorly maintained facilities, power outages without much notice, dirty.’  

‘With my disability, I have access to all necessary facilities.’ 

Household characteristics that affect tenant satisfaction

Household characteristics relate to a range of aspects relating to the home such as the composition of those who live there, overcrowding and underutilisation, and length of tenancy.

Employment status affects tenant satisfaction

Employment status was significantly associated with the likelihood of tenant satisfaction (Table R.2). Tenants who reported that they were employed were significantly more likely to be satisfied than those who were not employed. It should be noted that this factor was only found to be significant where all housing programs were combined, not for individual housing programs. 

Housing utilisation affects tenant satisfaction

Housing utilisation was also found to be significantly associated with tenant satisfaction in regression analysis (Table R.2). With all else being equal, tenants living in overcrowded dwellings were less likely to be satisfied with their social housing than those living in dwellings that were classed as adequate. This factor was only found to be significant where all housing programs were combined, and for community housing. See Glossary for definition of the Canadian National Occupancy Standard (CNOS) that is used to classify housing utilisation status.

Social housing factors that affect tenant satisfaction

Housing program affects tenant satisfaction

Housing program was significantly associated with tenant satisfaction in 2023 (Table R.2). With all else being equal, community housing tenants were more likely to be satisfied than public housing tenants. SOMIH tenants were less likely to be satisfied than public housing tenants, but the difference was not found to be statistically significant (Table R.3). 

State location affects tenant satisfaction

State or territory was also significantly associated with tenant satisfaction among social housing tenants in 2023. With all else being equal, social housing tenants in New South Wales, Victoria, Tasmania and the Australian Capital Territory were less likely to be satisfied than those in Queensland across all housing programs. 

See technical notes for detailed information on these results. Other findings from the regression analysis relate to neighbours and wellbeing. These are described in the following section.

 ‘The team leader was very professional, took notice of both my wife and my selves’ disabilities and made sure our problems were solved.’

‘Friendly and helpful staff interactions. Thank you for your assistance during these difficult times, it’s very much appreciated. Not just for myself, but for also for my daughter.’   

Psychosocial factors that affect tenant satisfaction

Relationship with neighbours affects tenant satisfaction

For the first time in 2023, tenants were asked whether they would be comfortable turning to a neighbour for assistance or support in various scenarios. Regression analysis found that tenants who reported they were not comfortable to turn to a neighbour for help were less likely to be satisfied than tenants who were comfortable to do so. This was true across all housing programs (Figure Factors.1, Table R.2). For SOMIH alone, however, this difference was not found to be statistically significant (Figure Factors.4, Table R.3). 

‘Difficulty with being understood stops me from engaging with strangers. It would depend on the neighbour. I have support from family and long-term friends.’ ‘I could call my neighbour if I was unable to help myself.’

‘They are not the kind of people you would ask for anything at all.’

‘I could call my neighbour if I was unable to help myself.’ 

 ‘My neighbours treat me with disrespect.’

Figure Factors.4: Predicted probability (%) of being satisfied with the overall service provided by an organisation, by level of comfort with neighbours, 2023

This horizontal bar chart shows that tenant satisfaction (predicted probability) was lower when tenants were not comfortable turning to a neighbour. This trend was consistent across housing programs. 

Experiences relating to wellbeing affect tenant satisfaction

In 2023, tenants were asked about a range of experiences related to their wellbeing over the past 12 months. Regression analysis found that, across all housing programs, tenants who reported higher levels of worry or anxiety and tenants who reported difficulty paying rent or bills were less likely to be satisfied than those who did not report these issues. This differed somewhat across housing programs, with public and community housing tenants less likely to be satisfied if they reported experiencing higher levels of worry or anxiety in the past 12 months, while struggling to pay rent or bills had a stronger negative effect on SOMIH tenants’ satisfaction than that of the other to housing programs (Table R.3).