Overview of cancer in Australia, 2024
The following provides a brief summary of some notable trends in the latest cancer data. More comprehensive data is available throughout the Cancer data in Australia report for the cancers summarised as well as many other cancers.
Please note that when survival rates are discussed in the summary that these are relative survival rates. Age-standardised incidence and mortality rates are standardised to the 2024 Australian population. All rates are age-standardised unless they are for specific age groups or are otherwise specified. All cancers combined incidence data excludes basal and squamous cell carcinomas of the skin. When discussing histology types, NOS is the abbreviation for ‘not otherwise specified’. The presence of NOS after a term generally indicates that a diagnosis is not as specific as it could theoretically be. For example, there are many kinds of adenocarcinoma but often the diagnosis is simply “adenocarcinoma”. This is referred to as “adenocarcinoma NOS”.
All cancers combined
The annual number of cancer cases diagnosed may surpass 200,000 by 2034
In 2000, there were around 88,000 cases of cancer diagnosed in Australia. By 2024, it is estimated there will be around 169,000 cases of cancer diagnosed in Australia. An increase of around 93% over 24 years with the majority of the increase due to increases in population size and increasing numbers of people reaching older ages for which cancer rates are higher.
Had the cancer incidence rates from 2000 for the various age groups remained constant between 2000 and 2024 there would be around 158,000 cases of cancer diagnosed in Australia in 2024 – an increase of around 70,000 cases. This number is reflective of increases due to population size and the ageing population alone. The additional cases to arrive at the estimated 169,000 cases is indicative of the increase due to increasing cancer rates. Overall, around 86% of the estimated increase of cancer incidence between 2000 and 2024 is attributable to population increase and the ageing population alone.
By 2034, with increasing population and estimated increasing rates of cancer, it is estimated there will be around 209,000 cases of cancer diagnosed in Australia.
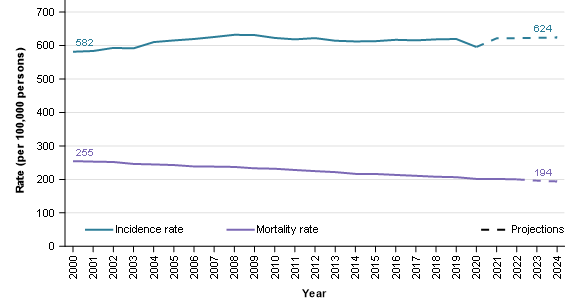
The age-adjusted cancer incidence rate increased from 582 cases per 100,000 people in 2000 to an estimated 624 cases per 100,000 people in 2024. Over the corresponding period, age-adjusted cancer mortality rates decreased from 255 deaths per 100,000 people to an estimated 194 deaths per 100,000 people (Figure 1). Increasing cancer survival rates increase the gap between incidence and mortality rates.
Figure 1: Age-standardised cancer incidence and mortality rates, persons, 2000–2024
Notes
- Rates are standardised to the 2024 Australian population.
- 2023 and 2024 are projections for mortality and 2021 to 2024 are projections for incidence.
Source: AIHW Australian Cancer Database 2020 and National Mortality Database
Cancer survival rates continue to increase
The 5-year survival for cancer in 1991–1995 was 55% and by 2016–2020, the rate had increased to 71%.
Even with decreasing mortality rates and increasing survival, the number of deaths from cancer has been increasing. In 2000, there were around 36,000 deaths from cancer and by 2024 the number of deaths from cancer is estimated to have increased by 45% to 53,000 people. Had mortality rates from 2000 not improved and remained constant, there would have been around 69,000 deaths from cancer in 2024.
Males remain more likely to be diagnosed with cancer
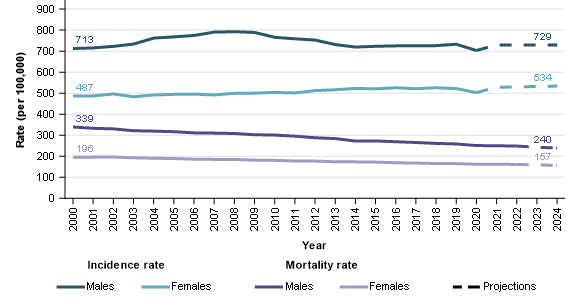
Males continue to be more likely to be diagnosed with cancer although the difference in age-adjusted incidence rates between males and females in 2024 is less than it was in 2000. In 2024, the age-adjusted cancer incidence rate for males is estimated to be 729 cases per 100,000 males and increased from 713 cases per 100,000 males in 2000. For the same period, the equivalent rate for females increased from 487 cases per 100,000 females to 534 cases per 100,000 females.
Age-adjusted cancer mortality rates for males and females have decreased between 2000 and 2024. The age-adjusted mortality rates for males decreased from 339 deaths per 100,000 males to an estimated 240 deaths per 100,000 males. The decrease in the age-adjusted mortality rate for females over the same period was 196 deaths per 100,000 females to 157 deaths per 100,000 females. Similar to cancer incidence, the difference in cancer mortality rates between males and females remains high in 2024 but is less than it was in 2000 (Figure 2).
Figure 2: Age-standardised cancer incidence and mortality rates, by sex, 2000–2024
Notes
- Rates are standardised to the 2024 Australian population.
- 2023 and 2024 are projections for mortality and 2021 to 2024 are projections for incidence.
- Prostate cancer incidence rates increased in the early 2000s before decreasing. The rate changes strongly influenced all cancers combined rates for males. More information about prostate cancer incidence is available in Cancer data commentary 9.
Source: AIHW Australian Cancer Database 2020 and National Mortality Database
Between 1991–1995 and 2016–2020, the 5-year survival rate for females increased from 59% to 73%. The corresponding survival rates for males improved from 51% to 70%. The greater improvements in survival for males and small increases in incidence rates leads to decreases in the gap between male and female mortality rates.
COVID-19 lockdown and the reduction of cancer cases
In 2020, the number of cases of cancer diagnosed decreased for the first time since 1996 with 147,500 cases diagnosed in 2020, compared with 148,800 cases diagnosed in 2019. This is different to the pattern from 2000 and 2019 where the number of cancer cases diagnosed increased, on average, 3,200 cases per year (Figure 3). The number of cases diagnosed in 2020 was less across the most common cancers, with decreases of around 1,000 cases for both colorectal cancer and melanoma of the skin. There was also a decrease of just over 500 for breast cancer and a very small increase for prostate cancer (89 cases) compared with prostate cancer increases of around 1,000 cases in previous years.
These decreases coincide with the onset of COVID-19 and associated restrictions and lockdowns. It is known that the Breastscreen Australia was closed for around a month and people were less willing to visit medical practitioners. At this stage it is not clear what impact this will have on cancer outcomes.
Figure 3: Cancer cases diagnosed, persons, 2000–2020
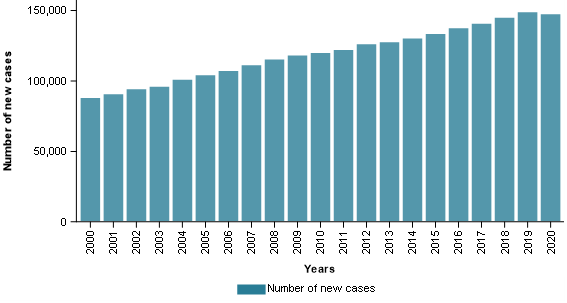
Source: AIHW Australian Cancer Database 2020
Cancer is becoming more commonly diagnosed in people in their 30s and 40s
Cancer occurs across all ages but is more common in older ages. To highlight the difference by age, cancer incidence rates for people under the age of ten is estimated to be 16 cases per 100,000 people in 2024 while for people in their eighties it is estimated to be around 2,800 cases per 100,000 people.
Cancer remains most common in older ages (in 2024 an estimated 88% of cancers diagnosed will occur in people aged 50 or more. However, cancer incidence rates for the young are increasing. This section focuses on cancer incidence of the populations aged 30 to 49. These age groups account for around 84% of the 20,000 cancer cases estimated to be diagnosed in the population under 50 in 2024.
Cancer incidence rates for people in their thirties and forties have been increasing. The age-specific rates for the respective age groups increased between 2000 to 2024 from 121 cases per 100,000 people to an estimated 141 cases per 100,000 people and from 280 to 323 cases per 100,000 people.
Cancers strongly contributing to cancer incidence rate increases for people in their thirties are colorectal cancer and thyroid cancer. Cancers strongly contributing to cancer incidence increases for the population in their forties are thyroid cancer, breast cancer, prostate cancer, colorectal cancer, and kidney cancer. Table 1 provides an overview of some of the cancers contributing to the increasing rates as well as the cancers that are more common within these age groups.
| Cancer type / group | People aged 30 to 39 | People aged 40 to 49 | ||||
|---|---|---|---|---|---|---|
| Rate in 2000 | Rate in 2024 | Change in rates | Rate in 2000 | Rate in 2024 | Change in rates | |
| Breast cancer | 22.1 | 23.0 | 0.9 | 76.6 | 85.6 | 9.0 |
| Cervical cancer | 5.5 | 8.0 | 2.5 | 5.6 | 8.5 | 2.9 |
| Colorectal cancer | 6.3 | 17.2 | 10.9 | 24.9 | 29.9 | 5.0 |
| Kidney cancer | 2.0 | 3.7 | 1.7 | 7.0 | 11.6 | 4.6 |
| Liver cancer | 0.3 | 0.5 | 0.2 | 2.1 | 2.4 | 0.3 |
| Lung cancer | 2.1 | 2.1 | 0.0 | 11.4 | 9.4 | -2.0 |
| Melanoma of the skin | 31.4 | 23.6 | -7.8 | 50.5 | 52.2 | 1.7 |
| Pancreatic cancer | 0.5 | 1.5 | 1.0 | 3.2 | 5.2 | 2.0 |
| Prostate cancer | 0.1 | 0.3 | 0.2 | 4.9 | 11.6 | 6.7 |
| Testicular cancer | 7.3 | 9.9 | 2.6 | 4.1 | 5.6 | 1.5 |
| Thyroid cancer | 7.0 | 16.8 | 9.8 | 9.6 | 20.8 | 11.2 |
| Uterine cancer | 1.2 | 2.9 | 1.7 | 5.3 | 8.3 | 3.0 |
| All cancers combined | 120.5 | 141.1 | 20.6 | 280.1 | 323.2 | 43.1 |
Source AIHW Australian Cancer Database 2020
Cancer mortality rates for people aged in their 30s are decreasing
Even though cancer incidence rates have been increasing, cancer mortality rates have been decreasing for people aged in their thirties and forties. For people in their forties age-specific mortality rates have been steadily decreasing between 2000 and 2024 (60 deaths per 100,000 people to an estimated 37 deaths per 100,000 people). The cancer mortality rate also decreased for people aged in their thirties over this time (18 deaths per 100,000 people to an estimated 12 deaths per 100,000 people).
The incidence rate increases for various cancers noted in Table 1 were not generally accompanied by corresponding mortality rate increases. The most notable exception was colorectal cancer for people in their thirties where the mortality rate increased by 1 death per 100,000 people (1.8 to an estimated 2.8 deaths per 100,000 people). The Cancer mortality by age data visualisation provides more information about the changing mortality rates of cancers for people in their thirties and forties.
Cancer accounts for around 3 of every 10 deaths in Australia
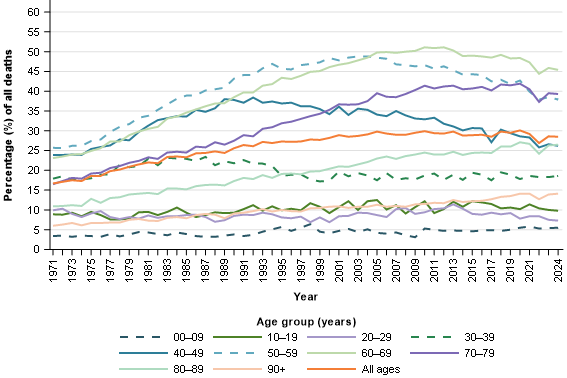
In 2024, it is estimated that cancer will be responsible for around 3 of every 10 deaths in Australia. The percentage has increased gradually from 17% in 1971 but has been relatively stable between 28% and 30% from the turn of the century.
The proportion of deaths from cancer varies considerably by age (Figure 4). In 2024, cancer is estimated to be responsible for around 45% of deaths in the population aged 60 to 69. The 0 to 9 age group has the smallest percentage of deaths from cancer and is estimated to be responsible for 5.5% of all deaths for the age group in 2024. In the 1970’s the proportion of deaths from cancer for this age group did not exceed 4%.
Figure 4: Percentage of deaths from cancer, by age group, 1971–2024
Note
- 2023 and 2024 are projections.
Source: National Mortality Database
Prostate cancer
In 2024, prostate cancer is estimated to be the most commonly diagnosed cancer for males and for Australia overall. With an estimated 26,400 cases diagnosed in 2024, prostate cancer is estimated to account for 28% of the cancers to be diagnosed in males for the year.
Since 2000, prostate cancer incidence rates have been more volatile than any other cancer (see Cancer commentary 9). Prostate cancer incidence projections have more uncertainty than other cancers but, if more recent prostate cancer incidence rates were to remain the same and occur in future years, there will be around 31,800 cases of prostate cancer diagnosed in 2034.
In 2020, over 96% of prostate cancers diagnosed were adenocarcinomas. The 5-year survival rate for this type of prostate cancer in 2016–2020 was 98% and strongly influenced the overall prostate cancer 5-year survival rates of 96% for the period.
While prostate cancer survival rates are high, exceptions exist such as neuroendocrine neoplasms. Between 2016 and 2020, around 0.1% of prostate cancers diagnosed were neuroendocrine neoplasms. The 5-year survival rates for these prostate cancers in 2016–2020 was 9.9%.
Prostate cancer mortality rates have been decreasing this century. Prostate cancer mortality rate reductions began in the early to mid-1990s, several years after the introduction of prostate specific antigen testing. In 1994, prostate cancer mortality rates were 62 deaths per 100,000 males. In 2024, it is estimated that prostate cancer mortality rates will be 33 deaths per 100,000 males.
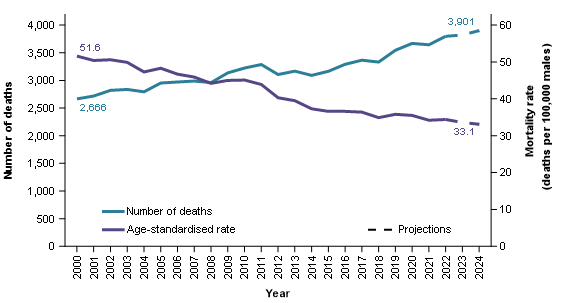
While the mortality rates have been decreasing, the number of deaths from prostate cancer continue to rise (Figure 5). In 2000, there were around 2,700 deaths from prostate cancer and in 2024 it is estimated there will be around 3,900. Population growth in combination with an ageing population exceeds reductions in age-adjusted mortality rates to result in increasing numbers of deaths from prostate cancer.
Figure 5: Prostate cancer deaths and age-standardised mortality rate, 2000–2024
Notes
- Rates are standardised to the 2024 Australian population.
- 2023 and 2024 are projections.
Source: National Mortality Database
Breast cancer
Breast cancer is the most commonly diagnosed cancer for females in Australia.
It is estimated there will be around 21,000 breast cancer cases diagnosed in females in 2024. This is around 28% of the estimated cancers diagnosed in females. It is the second most commonly diagnosed cancer in Australia for persons aged 20 to 39 and 60 to 79, and the most commonly diagnosed cancer for persons aged 40 to 59.
Breast cancer incidence has increased from 134 cases per 100,000 females in 2000 to an estimated 149 cases per 100,000 females in 2024. A large portion of this increase occurred around 2013 when breast screening was expanded to include women aged 70 to 74.
Breast cancer 5-year survival improved from 79% in 1991–1995 to 92% in 2016–2020.
While survival rates for breast cancer overall are high, there is substantial variation in survival for different types of breast cancer. For females, carcinomas were the most common type of breast cancer accounting for 99% of all breast cancer cases in 2020. The main types of breast carcinoma were ductal carcinomas (84% of all breast cancer cases) followed by lobular carcinomas (13%). There are different types of ductal carcinomas which have varied survival rates. The most common type of ductal carcinoma, the infiltrating duct carcinoma (NOS) (74% of all breast cancers), had a 5-year survival of 93% in 2016–2020. For the same period, other less common ductal carcinomas had much lower 5-year survival rates (for example, inflammatory carcinomas (59%) and metaplastic carcinomas (75%)).
In 2024, it is estimated that nearly 3,300 females will die from breast cancer; in 2000, around 2,500 females died from breast cancer. Like many other cancers, the increasing number of deaths is attributable to increasing population size and the ageing population. Age-adjusted breast cancer mortality rates have been decreasing for females and were around 30 deaths per 100,000 females in 2000 compared to an estimated 22 deaths per 100,000 females in 2024.
Melanoma of the skin
Melanoma of the skin incidence rates have increased from 53 cases per 100,000 people in 2000 to an estimated 70 cases per 100,000 people in 2024. In 2024, it is estimated that 35% of melanoma of the skin cancer cases are diagnosed on the trunk of the body, 26% on the upper limbs (including shoulder), 18% on the lower limbs (including hip) and 7.7% on the scalp and neck.
The proportion of melanoma of the skin diagnosed by site varies by sex. For example, in 2024 it is estimated that 25% of melanoma of the skin cases are diagnosed on the lower limbs (including hip) for females while for males it is 13%. Conversely, the trunk accounts for 41% of the cases for males and 27% for females.
Melanoma of the skin incidence rates for females are estimated to be 56 cases per 100,000 females in 2024 while male rates are 86 cases per 100,000 males.
Melanoma of the skin incidence rates have been decreasing for people under 40 since the late-1990s. Incidence rates for people aged 40 to 49 ranged between 44 and 53 cases per 100,000 people since the mid-1990s. Rates for people aged 50 and over continue to rise, although there was a decrease in 2020 which was also the year where COVID-19 restrictions were in place.
The ‘Slip Slop Slap’ campaign was a very large skin cancer awareness and prevention campaign commencing from the early 1980s. In 2024, the population aged under 40 were born after or around the ‘Slip Slop Slap’ campaign and have spent their lives in an environment where skin cancer awareness has been greater. Skin cancer awareness and prevention advice continues today. While populations over 40 have increasing incidence rates, the rate increases are greater for the oldest populations who are likely to have spent more of their lives in times when there was less skin cancer awareness.
After many years of increasing, melanoma of the skin mortality age-adjusted rates peaked at 8.0 deaths per 100,000 people in 2013. In 2024, the estimated age-adjusted mortality rate is 4.9 deaths per 100,000 people. The reduction in mortality rates is accompanied by reductions in the number of deaths (1,625 deaths in 2013 and an estimated 1,340 in 2024).
Since 1996–2000, 5-year melanoma of the skin survival rates have been a little over 90%. The melanoma of the skin 5-year survival rate for 2016–2020 was 94% and is the highest rate recorded for melanoma of the skin.
Colorectal cancer
With around 15,500 cases estimated, colorectal cancer is estimated to be the fourth most commonly diagnosed cancer in Australia in 2024. At the beginning of the century, it was the most diagnosed cancer in Australia.
Since 2000, colorectal cancer incidence rates have decreased more than any other cancer. Age-standardised incidence rates peaked in 2001 at 86 cases per 100,000 people and is estimated to have decreased to an estimated age-standardised rate of 57 cases per 100,000 people in 2024.
Five-year survival for colorectal cancer increased from 56% in 1991–1995 to 71% in 2016–2020. Decreasing incidence combined with improvements in survival have led to reducing mortality rates. The age-standardised mortality rate for colorectal cancer decreased from 35 deaths per 100,000 people in 2000 to an estimated 19 deaths per 100,000 people in 2024.
Colorectal cancer is far more common in the older population than the young. In 2024, around 6.5% of colorectal cancers are estimated to be diagnosed in people aged under 40. In 2000, only around 2.2% of colorectal cancers were diagnosed in people aged under 40. The increasing proportion occurred because, while colorectal cancer is decreasing overall and for older populations, colorectal cancer incidence is increasing for the young.
Incidence rates for younger populations remain much lower than for older populations but the trends are very different. Age groups under 40 years old have seen increases in incidence rates of colorectal cancer, particularly since around 2005. Incidence rates for 40–49 year olds increased from 22 cases per 100,000 people in 2005 to an estimated 30 cases in 2024. Over the same period, incidence rates decreased from 201 cases per 100,000 people to 142 cases per 100,000 people for the population aged 50 and over.
Some portion of the increasing rates for the younger population is attributable to neuroendocrine neoplasms but increases also occur for adenocarcinomas in the 20–39 age group. The increase for neuroendocrine neoplasms more generally may be explained by various factors such as increasing incidence of this malignancy, improvements in imaging technologies, increased use of endoscopy and colonoscopy, increased awareness in clinical practice and the introduction of the 2010 World Health Organisation classification for neuroendocrine tumours (Wyld D et al. 2019).
Cancer survival rates are higher for younger populations than older. In 2016–2020, survival was 98% for 0–19 year olds, between 70–81% for age groups 20–39, 40–59 and 60–79 years old, and 61% for 80 years and older.
Colorectal cancer sites and types diagnosed differ by age. Some of these differences are discussed below but much more comprehensive information is available in the cancer by histology and cancer by subsite data visualisations and spreadsheets.
Colorectal cancer can originate in the broad areas of the colon, rectum or the rectosigmoid junction (which is the limit separating the sigmoid colon and the rectum). In 2024, it is estimated that most cases of colorectal cancer will be in the colon (71% of all colorectal cancer cases), followed by the rectum (22%) and lastly the rectosigmoid junction (7%). The appendix, which is part of the colon, is not a common site of colorectal cancer in the overall population (estimated 5.6% of cases in 2024). However, the majority of colorectal cancer cases in the youngest age groups are located in the appendix (estimated 97% of cases in 0–14 year olds and an estimated 88% of cases in 15–24 year olds in 2024).
The majority of colorectal cancers diagnosed were carcinomas (95% of all colorectal cancers in 2020). In the general population, the most common type of colorectal carcinoma diagnosed was adenocarcinomas (87%) followed by neuroendocrine neoplasms (5.5%). However, neuroendocrine neoplasms were very common in younger age groups accounting for 100% and 81% of colorectal cancer cases in 0–14 and 15–24 year olds respectively.
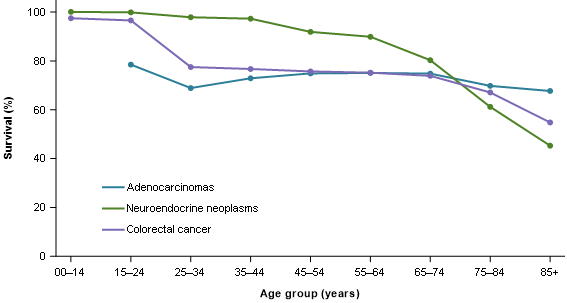
Colorectal survival outcomes differ by age and type. Figure 6 provides a small selection of these for 2016–2020. Adenocarcinomas had a 5-year survival of 73% in 2016–2020 while neuroendocrine neoplasms had 89% survival. However, the difference in survival for neuroendocrine neoplasms is partly due to greater proportions of cases of this cancer being in younger age groups, who tend to have higher survival than older age groups. More extensive statistics are available in the cancer by histology data visualisation and Excel data.
Figure 6: Colorectal cancer 5-year relative survival by specified histologies, by age group, 2016–2020
Source: AIHW Australian Cancer Database 2020
Lung cancer
With around 15,100 cases estimated, lung cancer is estimated to be the fifth most commonly diagnosed cancer in Australia in 2024. Of the 5 most common cancers in Australia, its survival rates are the lowest (5-year survival of 26% in 2016–2020 for lung cancer with colorectal cancer survival the next lowest at 71%).
While lung cancer is a low survival cancer, 5-year survival rates have improved over time. Survival increased from 9.7% in 1991–1995 to 21% in 2016–2020 for males and from 12% to 31% for females. Survival differs by age with 5-year survival at 94% for 20–24 year-olds, 76% for 25–29, 61% for 30–34, between 23% and 36% for age groups between 40 and 79, and only 9.1% for those aged 85 and over in 2016–2020.
Lung cancer age-standardised incidence rates have been fairly stable at 57 cases per 100,000 people in 2000 to an estimated 56 cases in 2024. National rates are however comprised of very different trends for males and females. Males have seen strong and enduring decreases from 84 cases per 100,000 males in 2000 to an estimated 61 cases per 100,000 males in 2024. In contrast, females have seen an increase from 36 cases per 100,000 females in 2000 to an estimated 52 cases per 100,000 females in 2024.
The increasing incidence rates of this low survival cancer have seen lung cancer account for increasing proportions of cancer deaths for females. In 2000, lung cancer accounted for around 15% of cancer deaths in females and is estimated to be 17% in 2024. Conversely, lung cancer represented 22% of all cancer deaths for males in 2000 and this is estimated to reduce to 17% in 2024.
In 2024, it is estimated that around 8,900 people will die of lung cancer in Australia. This is the most common cause of cancer-related death. Age-standardised mortality rates for males have decreased substantially from 74 deaths per 100,000 males in 2000 to an estimated 39 deaths per 100,000 males in 2024. Female lung cancer mortality rates remain lower than males, but in contrast to males have increased from 29 deaths per 100,000 females in 2000 to a peak of 32 deaths per 100,000 females in 2010 before decreasing to an estimated 28 deaths per 100,000 females in 2024.
Blood cancers
All blood cancers combined is the aggregate of many different types of blood cancer. While useful for detailing the overall number of cases and general survival of these cancers in Australia, different types of blood cancer often have different incidence and mortality trends and survival rates.
In 2024, it is estimated that around 20,000 people will be diagnosed with a blood cancer (59% in males). The most common type of blood cancer in 2024 is estimated to be non-Hodgkin lymphoma followed by multiple myeloma and then chronic lymphocytic leukaemia.
Blood cancers accounted for an estimated 12% of all cancer cases in 2024. However, blood cancers are relatively more common in the 0–19 year old age group accounting for an estimated 40% of all cancer cases. While not a common cancer in the general population, acute lymphoblastic leukaemia was the most common cancer diagnosed in 0–19 year olds (estimated 17% of cancer cases in 2024).
Age-standardised incidence rates for blood cancer increased from 66 cases per 100,000 people in 2003 to an estimated 74 cases in 2024. Males have had consistently higher rates of all blood cancers combined than females (estimated 92 compared to 58 cases per 100,000 males and females respectively in 2024).
Five-year survival for blood cancers increased slightly from 67% in 2011–2015 to 70% in 2016–2020. In 2016–2020, 5-year survival was over 90% for age groups 0–19 and 20–39, and then decreased with increasing age from 85% in 40–59 year olds to 70% in 60–79 year olds to 44% for those aged 80 years older. There is substantial variation in survival between different types of blood cancer. Blood cancers with comparatively higher 5-year survival in 2016–2020 were immunoproliferative cancers (92%), Hodgkin lymphoma (89%), and chronic lymphocytic leukaemia (87%). Lower survival blood cancers included acute myeloid leukaemia (27%) and myelodysplastic syndromes (39%).
Age-standardised blood cancer mortality decreased from 30 deaths per 100,000 people in 2000 to an estimated 23 deaths in 2024. This decrease was seen in both males and females although males had consistently higher mortality rates.
The Cancer data in Australia report contains finer details of blood cancer incidence and survival rates. For example, Hodgkin lymphoma incidence and survival statistics are accompanied by statistics on types of Hodgkin lymphoma such as nodular lymphocyte predominant Hodgkin, classic Hodgkin lymphoma and the subtypes nodular sclerosis classic Hodgkin lymphoma, lymphocyte-rich classic Hodgkin lymphoma, mixed cellularity classic Hodgkin lymphoma and lymphocyte-depleted classic Hodgkin lymphoma. The Blood cancer by histology data visualisations provide more detailed blood cancer statistics.
Gynaecological cancers
Gynaecological cancers include cervical cancer, ovarian cancer, placenta cancer, uterine cancer, vaginal cancer, vulvar cancer, and cancer of other female genital organs. Gynaecological cancer is estimated to account for around 9.2% of cancers diagnosed in females in 2024 and around 9.7% of female deaths from cancer.
In the following paragraphs, ovarian cancer and serous carcinomas of the fallopian tube are discussed rather than ovarian cancer. This is because the time series for this cancer appears to better reflect ovarian cancer as it is more traditionally understood while ovarian cancer trends are complicated by the changed understanding of where many serous carcinomas originate (see Cancer data commentary 5 for more information).
Gynaecological cancer age adjusted incidence rates ranged between 49 and 53 cases per 100,000 females between 1982 and 1994 before decreasing to a low of 44 cases per 100,000 females in 2003. Decreases in cervical cancer incidence drove the reduction where rates decreased from 14 to 7.7 cases per 100,000 females between 1994 and 2003. The National Cervical Cancer Screening program was introduced in 1991 and led to falls in cervical cancer incidence and mortality due to the program’s ability to detect pre-cancerous abnormalities that may, if left, progress to cancer.
Since 2003, gynaecological cancer incidence has gradually increased to an estimated 49 cases per 100,000 females in 2024. Uterine cancer has largely influenced this change and increased from 20 to an estimated 24 cases per 100,000 females between 2003 and 2024. Uterine cancer incidence had been increasing before this time and has been steadily and gradually increasing since 1989 (16 cases per 100,000 females).
Five-year survival for gynaecological cancers has improved from 64% in 1991–1995 to 71% in 2016–2020. There is substantial variation in survival between different types of gynaecological cancers. The gynaecological cancers with the highest survival in 2016–2020 were placenta (90%), and uterine (82%). Lower survival gynaecological cancers include ovarian cancer and serous carcinomas of the fallopian tube (49%) and vaginal cancer (54%). Ovarian cancer and serous carcinomas of the fallopian tube 5-year survival rates have been improving over time, increasing from 40% in 1991–1995.
The mortality rate for gynaecological cancer has changed from 17 deaths per 100,000 females in 2000 to an estimated 16 deaths in 2024. Mortality rates for cervical cancer decreased from 3.1 deaths per 100,000 females in 2000 to an estimated 1.7 deaths in 2024. Mortality for uterine cancer increased from 3.3 deaths per 100,000 females in 2000 to an estimated 4.8 deaths in 2024.
In 2024, ovarian cancer and serous carcinomas of the fallopian tube are estimated to account for around 26% of the gynaecological cancers diagnosed. With survival lower than other gynaecological cancers, and an estimated 1,070 deaths in 2024, ovarian cancer and serous carcinomas of the fallopian tube are estimated to account for 48% of the 2,240 deaths from gynaecological cancer in 2024.
Brain cancer
Brain cancer age-adjusted incidence rates from 2000 to 2024 ranged between 7.4 and 8.5 cases per 100,000 people. Males had higher incidence rates than females throughout this period. In 2024, the incidence rate for males is estimated to be 9.2 cases per 100,000 males and the rate for females is estimated to be 5.7 cases per 100,000 females.
Survival vastly differs by age; in 2016–2020, 5-year survival for brain cancer was 63% for 0–19 year olds, 69% for 20–39 year olds, 28% for 40–59 year olds, 8.7% for 60–79 year olds and 1.9% for people aged 80 years and over.
Overall, brain cancer survival has improved from 20% in 1991–1995 to 23% in 2016–2020. Brain cancer survival rates over time are often impacted by changes in the age composition of those diagnosed with brain cancer. In particular, greater proportions of older people are diagnosed and older people have lower survival rates. When adjusted for age, brain cancer 5-year survival has more than doubled from 11% in 1991–1995 to 23% in 2016–2020.
The mortality rate for brain cancer ranged from 5.9 to 7.0 deaths per 100,000 people between 2000 and 2024.
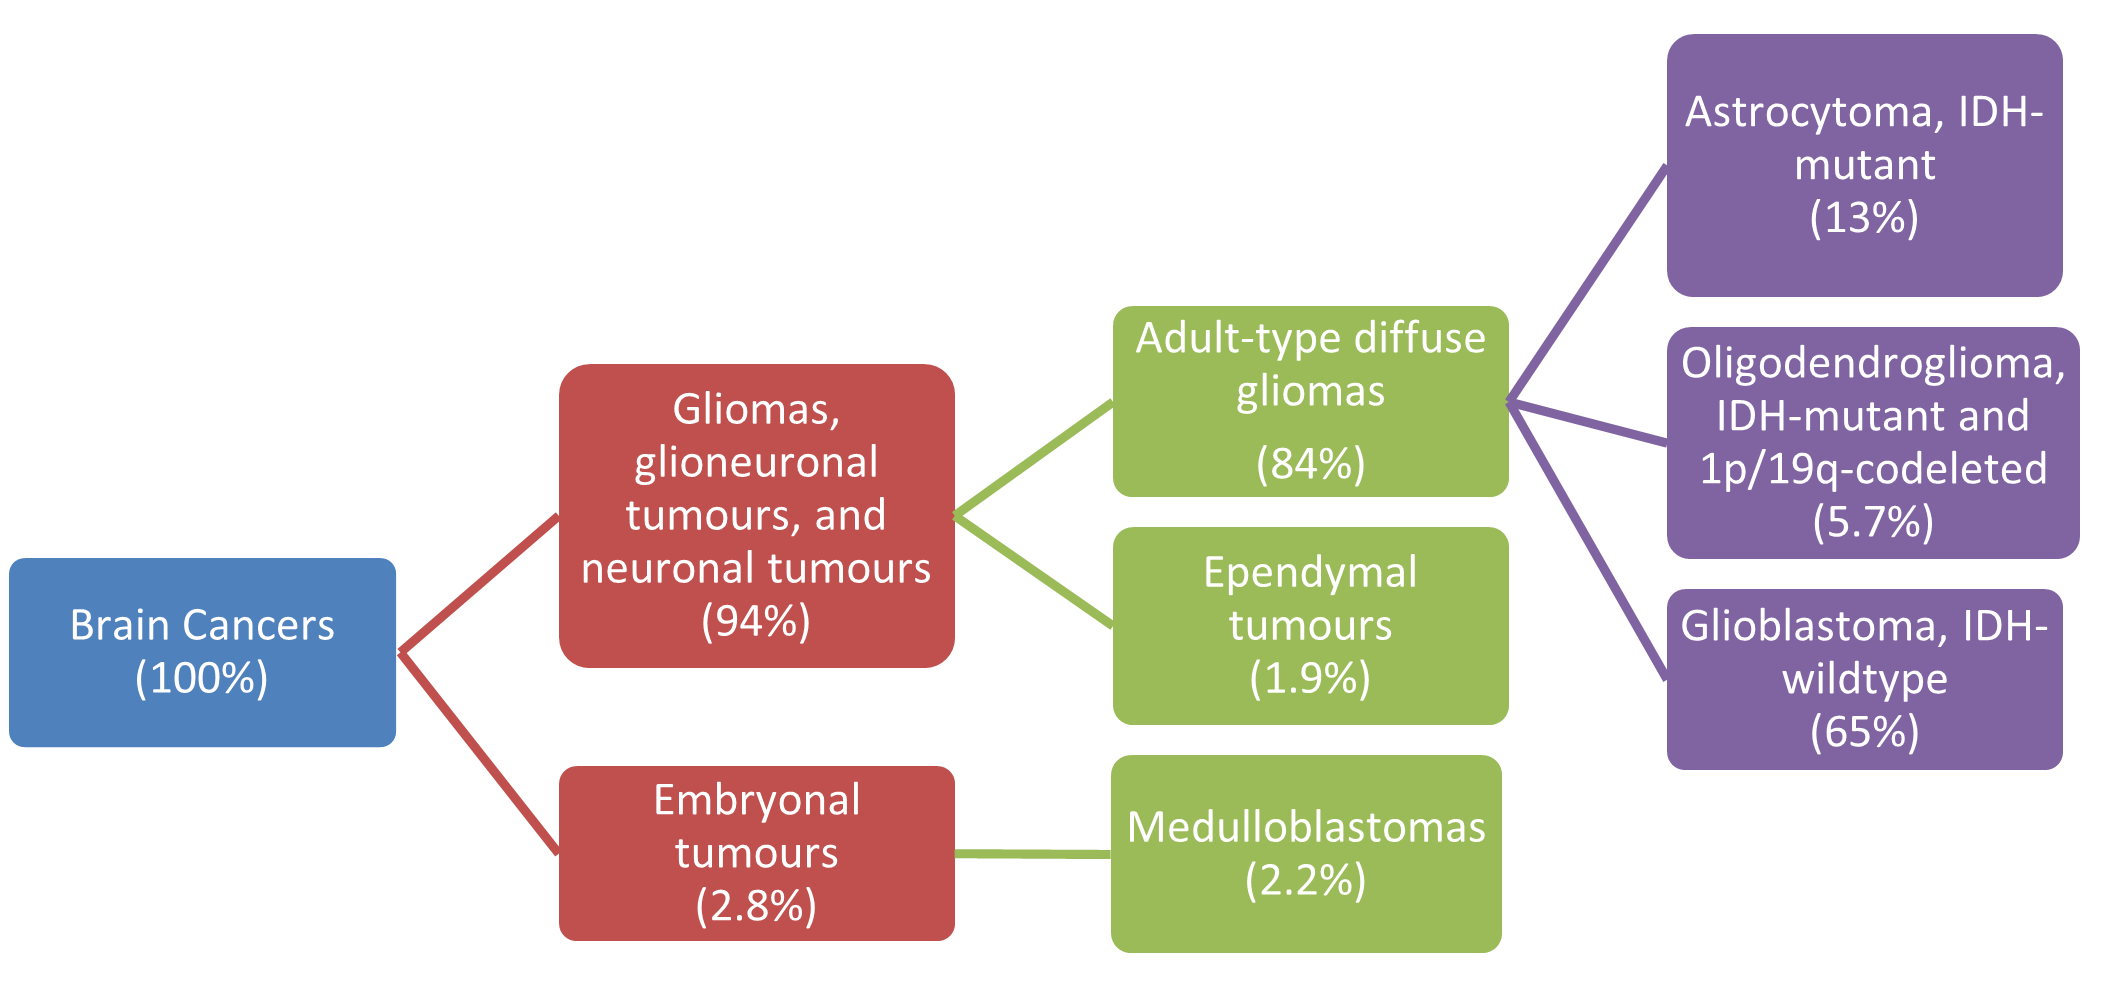
The most common types of brain cancer were gliomas, glioneuronal tumours and neuronal tumours, which accounted for 94% of brain cancers diagnosed in 2020. Embryonal tumours only accounted for 2.8% of brain cancers in the general population but 37% of brain cancers in 0–19 year olds. Survival varies considerably for different types of brain cancer. Glioblastomas, IDH-wildtype accounted for 65% of all brain cancers in 2020 and had a 5-year relative survival of only 5.9% in 2016–2020. Oligodendroglioma, IDH-mutant and 1p/19q-codeleted accounted for 5.7% of brain cancer cases and had 84% 5-year survival.
Figure 7: Brain cancer incidence, selected types, persons, 2020
Source: AIHW Australian Cancer Database 2020
Thyroid cancer
Thyroid cancer is a common cancer, with much higher rates in females. In 2024, it is estimated that around 4,300 cases will be diagnosed, approximately 70% of which will be in females.
The age-adjusted incidence of thyroid cancer increased from 8.5 cases per 100,000 females in 2000 to an estimated 22 cases per 100,000 females in 2024. While lower, the incidence rates for males have also increased from 3.3 cases to an estimated 10.0 cases per 100,000 males over the same period. The increase in thyroid cancer may be due to an increase in medical surveillance and the introduction of new diagnostic techniques such as neck ultrasonography (Vaccarella et al. 2016).
While thyroid cancer is common, it is a high survival cancer resulting in relatively few deaths. Five-year survival is higher for females than males (98% and 94% in 2016–2020 respectively).
Despite an increase in the incidence rate, the age-adjusted mortality rate for thyroid cancer has been broadly stable since 2000, between 0.5 and 0.7 deaths per 100,000 people. However, males are overrepresented in deaths from thyroid cancer. While it is estimated that only around 30% of thyroid cancer cases in 2024 will be in males, around half of the deaths are estimated to be males (79 of the 155 deaths in 2024).
Rare cancers
Rare Cancers Australia and RARECARENet defines a cancer to be ‘rare’ if it has an incidence rate of less than 6 cases per 100,000 people per year. If the incidence rate is greater than or equal to 6 cases per 100,000 people per year but less than 12 cases per 100,000 people per year, the cancer is ‘less common’. ‘Common’ cancers are defined as those with an incidence rate of 12 or more cases per 100,000 people per year. Crude incidence rates are used to define cancer rarity in this report.
Cancers can change rarity over time. Cancers that changed from rare to less common between 2000 and 2024 were chronic lymphocytic leukaemia, liver cancer, multiple myeloma and oesophageal cancer. Cancers that changed from less common to common were bladder cancer, kidney cancer and pancreatic cancer. Thyroid cancer was the only cancer to go from rare to common between 2000 and 2024.
Rare cancers are individually rare, but collectively are estimated to account for 12% of cases diagnosed in 2024. Less common cancers accounted for around 12% of cancer cases in 2024 and common cancers for around 76% of cases. While rare and less common cancers are estimated to collectively account for 24% of cases, they are estimated to account for 33% of all cancer deaths in 2024 (Table 2).
| Type | Number of cases | Percent of all cancer cases | Number of deaths | Percent of all deaths |
|---|---|---|---|---|
| Rare cancers | 19,861 | 12% | 7,354 | 15% |
| Less common cancers | 20,371 | 12% | 8,701 | 18% |
| Common cancers | 126,425 | 76% | 32,269 | 67% |
Notes:
- Rare cancers are those with incidence rates of less than 6 cases per 100,000 people. Less common cancers are those with incidence rates of at least 6 and less than 12 cases per 100,000 people. Common cancers are those with incidence rates of 12 or more cases per 100,000 people (with rarity based on estimated rates from 2024).
- Individual cancers were grouped based on rarity and the numbers of new cases were summed accordingly. Unknown primary site and cancer of other and ill-defined sites are excluded from cancer rarity classification.
- The sum of cancers by rarity for mortality will not equal all cancers combined estimated as stated from either the NMD or ACD as the individual cancers in the cancer rarity estimates were sourced from whichever of the NMD or ACD are recommended for use.
- Non-melanoma skin cancer rarity classification is derived from cancer incidence rates that exclude basal and squamous cell carcinomas of the skin. For consistency, non-melanoma skin cancer mortality also excludes basal and squamous cell carcinomas of the skin.
- The sum of cancers by rarity will not equal all cancers combined incidence totals from the ACD as the small number of bone cancers outside of C40-C41 ICD-10 coding are coded to bone cancer as well as the relevant ICD-10 site.
- Cancer incidence and mortality counts and proportions may change depending on the cancers included within analysis.
Source: AIHW Australian Cancer Database 2020 and National Mortality Database
Cancer rarity classifications using the International Classification of Diseases – Tenth Revision (ICD-10)
Histology refers to the cells or soft tissue in which cancer originates. ICD-10 coding generally relates to the site of the body. The cancer by rarity information within this report understates the number of cancers classified as rare in Australia compared to if histology was used to classify rarity – at present ICD-10 is used. The following helps to illustrate how cancer rarity would change when using histology information.
Prostate cancer is a common cancer. Using the ICD-10 framework, all 23,350 prostate cancer cases in 2020 were counted as common cancers. However, there are different types of prostate cancer when considered by histology – these include acinar adenocarcinoma and adenocarcinoma (NOS), infiltrating duct carcinoma (NOS), small cell carcinoma and mixed acinar-ductal carcinoma and many other types. In 2020, around 22,000 of the 23,350 prostate cancers were acinar adenocarcinoma and adenocarcinomas (NOS) and these would remain as classified as common cancers in a histology framework for cancer rarity. Each of the other mentioned prostate cancers would be categorised as rare cancers.
The prostate cancers are different types and their outcomes differ but the ICD-10 considers these only as prostate cancer and a common cancer. If histology were used, there would be at least another 200 cases of prostate cancer categorised as rare cancers in 2020. Similarly, all other common and less common cancers such as breast cancer, lung cancer, liver cancer and so on, would likely see a portion of the cancer types by histology categorised as rare cancers.
Each year in the CdiA, the number of cancers sites reported by histology has been increasing. Once all sites have their histology structure mapped for reporting, it will be possible to consider cancer rarity reporting by histology within this report.
Rare Cancer Europe notes several of the specific challenges presented by rare cancers. These include:
- late or incorrect diagnosis
- lack of access to appropriate therapies and clinical expertise
- very limited number of clinical studies due to the small number of patients
- lack of interest in developing new therapies due to limitations in the market (RCE 2021).
Between 1987–1991 and 2016–2020, rare cancers in Australia have not recorded the same degree of improvement in survival outcomes as less common or common cancers. The 5-year survival for the common cancer group increased by around 22 percentage points, the less common cancer group increased by around 19 percentage points and rare cancers by around 13 percentage points (Table 3).
Cancers can change rarity classification over time. Please note that the survival by rarity for Table 3 represents the survival rates for rarity based on 1989 cancer rarity classifications.
Survival rates by rarity for 2016–2020 based on 2024 rarity would see rare cancers 5-year survival as 59%, less common cancers at 53% and common cancers as 77%. Future survival rates will be able to consider whether the rare cancers of today, overall, improve more slowly than more common cancers. Less common cancers continue to include a higher proportion of cancers with lower survival rates such as brain cancer and liver cancer.
| Type | Survival 1987–1991 | Survival 2016–2020 |
|---|---|---|
| Rare cancers | 50% | 63% |
| Less common cancers | 24% | 43% |
| Common cancers | 57% | 79% |
Notes:
- Rare cancers are those with incidence rates of less than 6 cases per 100,000 people. Less common cancers are those with incidence rates of at least 6 and less than 12 cases per 100,000 people. Common cancers are those with incidence rates of 12 or more cases per 100,000 people.
- Rarity for this table used ICD-10 structure for cancers and 1987 rates to classify the rarity group for individual cancers.
- Non-melanoma skin cancer rarity classification is derived from cancer incidence rates that exclude basal and squamous cell carcinomas of the skin.
Source: AIHW Australian Cancer Database 2020
The following visualisation helps to understand cancer incidence by rarity over time. Caution is recommended interpreting the data as a time series. Changes in rates may be due to a cancer changing its rarity classification (for example, a rare cancer's rates increase and thereby becomes a less common cancer). The information does however illustrate that common cancers consistently represent the majority of cancers diagnosed in Australia. It also shows that while individually rare, rare cancers collectively consistently represent over 10% of the cancers diagnosed in Australia.
Figure 8 - Cancer incidence rates and counts, by cancer rarity groups (ICD-10), persons, 1982 to 2024

