Neuroendocrine neoplasms incidence and survival rates and trends
Cancer data commentary number 11
This commentary accompanies the new neuroendocrine neoplasm by cancer site reporting within the Cancer data in Australia report. The commentary discusses neuroendocrine neoplasms incidence and survival rates and trends in Australia. The commentary discusses rates by site and type of neuroendocrine neoplasm.
What are neuroendocrine neoplasms?
Cancers may be classified by cancer site such as lung cancer or breast cancer. The same cancers may further be classified by histology, which describes the types of cells in which the cancer originates.
Neuroendocrine neoplasms (NENs) are a histological based group of cancers, originating in neuroendocrine cells which are found throughout the body. Neuroendocrine cells receive signals from the nervous system and respond by making, storing, and secreting a variety of peptides and hormones to help control many of the body’s functions. NENs occur where neuroendocrine cells become malignant, they can occur anywhere in the body, in all types of organs as well as in soft tissues.
Overall, NENs are a common cancer
A common cancer may be defined as a cancer with a crude incidence rate of 12 cases per 100,000 people or more. There were 4,693 NENs diagnosed in 2020 with a crude rate of 18 cases per 100,000 people. As a group, neuroendocrine neoplasms are a common cancer.
NENs are most commonly diagnosed in the lungs and colorectum
In 2020, NENs accounted for 3.2% of cancers diagnosed. Of the 4,693 NENs cases diagnosed in 2020, 1,824 were diagnosed in the lungs. NENs were estimated to account for 14% of the lung cancer cases diagnosed in 2020.
In 2000, NENs of the lungs made up the majority of all NENs cases diagnosed (55%). In 2020, 39% of NENs were diagnosed in the lungs. The decrease is driven by NENs being increasingly diagnosed in other sites of the body rather than decreasing rates of NENs of the lung. The colorectum and pancreas are the sites where NENs proportional increases are greatest. In 2000, 11% of NENs were diagnosed in the colorectum and 2.5% in the pancreas. By 2020, these sites respectively accounted for 17% and 7.5% of NENs diagnosed.
In 2020, there were 804 cases of NENs diagnosed in the colorectal region (5.5% of colorectal cancer cases), 464 in the small intestine (56% of small intestine cancer cases), 353 in the pancreas (8.9% of pancreatic cancer cases) and 441 non-melanoma skin neuroendocrine neoplasm cases (33% of non-melanoma skin cancer (excluding basal and squamous cell carcinomas) cases).
Smaller numbers of NENs occur across many other sites of the body. For some sites, there may only be a handful diagnosed in a year, other sites may have cases rarely diagnosed across several years. The number and proportion that NENs represent of various cancer sites varies considerably. This data visualisation provides a more comprehensive overview of NENs incidence by cancer site.
NENs incidence rates continue to rise
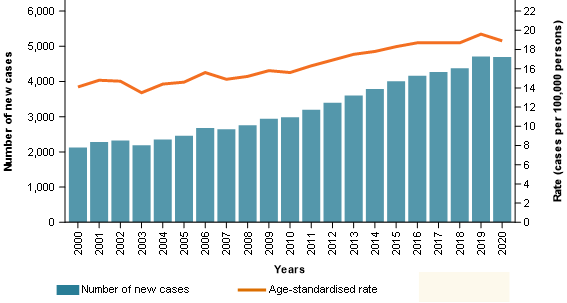
The number of NENs diagnosed more than doubled between 2000 and 2020 (2,123 cases in 2000 and 4,693 cases in 2020). When adjusted for age, the incidence rates for NENs increased from 14 to an estimated 19 cases per 100,000 people over the same period (Figure 1).
NENs incidence rates have been increasing for both sexes. Between 2000 and 2020, the age-adjusted incidence rate for males increased from 18 to 21 cases per 100,000 males and for females from 11 to 17 cases per 100,000 females.
Besides a true increase in the incidence of this malignancy, the steady rise of NEN diagnoses over the years may be explained by various factors such as improvements in imaging technologies, increased use of endoscopy and colonoscopy, increased awareness in clinical practice and the introduction of the 2010 World Health Organisation classification for neuroendocrine tumours (Wyld D et al. 2019).
Figure 1: Neuroendocrine neoplasms, cases and age-standardised incidence rates, persons, 2000 to 2020
Notes
- Rates are standardised to the 2024 Australian population.
Source: AIHW Australian Cancer Database 2020
NENs are more likely to be diagnosed in the young than most other cancers diagnosed
Like most cancers, NENs are more commonly diagnosed in the older population. However, as a group NENs are more likely to be diagnosed in the young than most other cancers. In 2020, around 9% of all NENs were diagnosed in people under the age of 40. For all cancers combined (and excluding NENs) around 5% of cancers were diagnosed in people under 40. The age distribution for NENs and propensity to occur in the young can vary considerably depending on the cancer site.
For appendiceal cancer, over half (61%) of the 378 NENs cases diagnosed in 2020 were diagnosed in people under the age of 40. There were 30 appendiceal cancer cases in people aged under 15 in 2020, all of these were NENs. Since 2000, almost all appendiceal cancer cases diagnosed under the age of 15 were NENs.
Pancreatic cancer is most commonly diagnosed in older ages (median age of diagnosis is 73 years of age in 2020). Around 9% of the 3,700 pancreatic cancer cases in 2020 were NENs. However, around 48% of the 62 pancreatic cancer cases for people aged 20 to 39 were NENs and that 19% of the 604 pancreatic cancer cases for people aged 40 to 59 were NENs.
NENs survival rates have been increasing
The overall 5-year relative survival for NENs improved from 39% in 2006-2010 to 52% in 2016-2020. Over the same period, the equivalent survival rate for all cancers combined increased from 66% to 71%.
The NENs increases in survival are influenced by the changing composition of the sites and types of NENs diagnosed. Lung cancer and unknown primary site have amongst the lowest survival rates for NENs (23% and 28% 5-year relative survival respectively in 2016–2020). In 2006, these cancers accounted for 59% of NENs diagnosed but by 2020 the proportion reduced to 44% (Table 1). The reducing proportion of these lower survival NENs and greater proportion of cancer sites with higher survival contributes to the 13-percentage point increase in overall NENs 5-year relative survival.
Table 1 provides NENs 5-year survival rate changes, by site, between 2006–2010 and 2016–2020. Only NENs of the pancreas have an increase of more than the 13 percentage points recorded by the group (Table 1). A more comprehensive overview of survival rates for NENs by site, age, sex, and type of NENs is available on this data visualisation page.
| Cancer site/type | 5-year relative survival (2006–2010) | 5-year relative survival (2016–2020) | Percentage of all NENs in 2006 | Percentage of all NENs in 2020 |
|---|---|---|---|---|
| Lung NENs | 15.5% | 22.8% | 52.4% | 38.9% |
| Colorectal NENs | 87.9% | 89.4% | 11.7% | 17.1% |
| Small intestine NENs | 83.6% | 88.0% | 6.2% | 9.9% |
| Pancreas NENs | 58.5% | 75.2% | 2.6% | 7.5% |
| Non-melanoma skin NENs | 49.1% | 54.0% | 10.1% | 9.4% |
| Unknown primary site NENs | 24.7% | 27.7% | 6.9% | 4.7% |
| Stomach NENs | 71.2% | 78.3% | 1.8% | 3.1% |
| Thyroid NENs | 83.1% | 88.9% | 1.8% | 1.3% |
NENs survival rates decrease with age
As is the case for cancer more generally, NENs survival rates decrease with increasing age. In 2016–2020, the 5-year relative survival for people diagnosed within NENs under the age of 40 was over 90%. Survival rates reduced with increasing age and was at 31% for people aged 80 and older (Figure 2).
Figure 2: 5-year relative survival rates, by age, persons, neuroendocrine neoplasms, 2006–2010 to 2016–2020.
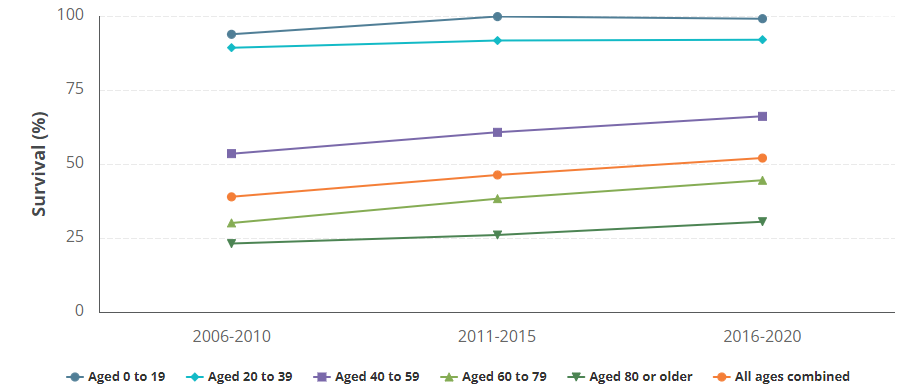
Source: AIHW Australian Cancer Database 2020
The majority of NENs are epithelial neuroendocrine neoplasms
Epithelial neuroendocrine neoplasms and non-epithelial neuroendocrine neoplasms are types of NENs. Epithelial neuroendocrine neoplasms include neuroendocrine tumours (NETs), neuroendocrine carcinoma (NEC), and mixed neuroendocrine and non-neuroendocrine neoplasms. Non-epithelial neuroendocrine neoplasms include paraganglioma and pheochromocytoma. A list of NENs by type can be found in the Data section of this report.
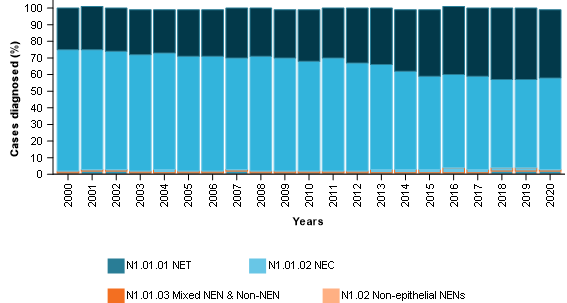
Almost all NENs are epithelial neuroendocrine neoplasms (98% in 2020). In 2020, about 42% of epithelial NENs were NETs, 57% were NECs and 1% were mixed neuroendocrine and non-neuroendocrine neoplasms. Over time the proportion of NETs diagnosed have been increasing while the proportion of NECs has been decreasing (Figure 3).
Figure 3: Proportion of NENs over time, by subtypes, 2000 to 2020
Notes
- Neuroendocrine tumours (NET), neuroendocrine carcinomas (NEC), mixed neuroendocrine and non-neuroendocrine neoplasms (Mixed NEN & Non-NEN), non-epithelial neuroendocrine neoplasms (non-epithelial NENs)
- The prefixes (such as N1.01.01) are part of an internal chart used to help illustrate the structure of types of neuroendocrine neoplasms. These are used within the neuroendocrine neoplasm data visualisations to help navigation in the visualisations and have no relation to NENs outside of this general assistance within the Cancer data in Australia report.
Source: AIHW Australian Cancer Database 2020
Neuroendocrine tumours are becoming more commonly diagnosed
NENs are a diverse group of tumours and life expectancy for people diagnosed with NENs can vary due to several factors, including the grade, stage and location of the tumour, patient’s overall health and effectiveness of treatment. Well-differentiated NETs have a better prognosis than poorly differentiated NECs. Differentiation is described as how different the tumour cells are from normal cells (Oronsky et al. 2017). Most NETs develop slowly over several years and may cause symptoms. For example, functional gastro-intestinal NETs may release excess serotonin which can cause diarrhea, facial flushing and tiredness (Pusceddu et al. 2020). NECs are usually aggressive fast-growing neoplasms that usually do not cause symptoms in the early stages (Klöppel 2017). Therefore, NECs may not be diagnosed early leading to poor prognosis and low survival.
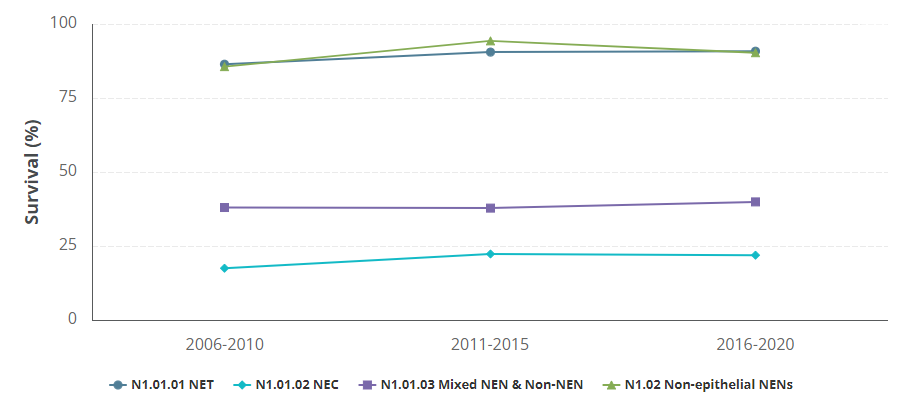
NECs have considerably lower survival rates than NETs (Figure 4). Figure 2 shows NENs survival increased by 13 percentage points between 2006–2010 and 2016–2020. NENs are comprised of NETs, NECs, mixed neuroendocrine and non-neuroendocrine neoplasms, and non-epithelial neuroendocrine neoplasms. The change in 5-year survival for each of these groups over between 2006–2010 and 2016–2020 were around 4, 4, 2 and 5 percentage points respectively (Figure 4). None of these reach the 13-percentage point change over time which further demonstrates that much of the NENs increase in survival rates is due to the changing composition of the types of NENs being diagnosed.
Figure 4: 5-year relative survival rates, by neuroendocrine neoplasm types, all ages combined, persons, 2006–2010 to 2016–2020
Notes
- Neuroendocrine tumours (NET), neuroendocrine carcinomas (NEC), mixed neuroendocrine and non-neuroendocrine neoplasms (Mixed NEN & Non-NEN), non-epithelial neuroendocrine neoplasms (non-epithelial NENs)
- The prefixes (such as N1.01.01) are part of an internal chart used to help illustrate the structure of types of neuroendocrine neoplasms. These are used within the neuroendocrine neoplasm data visualisations to help navigation in the visualisations and have no relation to NENs outside of this general assistance within the Cancer data in Australia report.
Source: AIHW Australian Cancer Database 2020
Finding more statistics about NENs
NENs rates and survival varies by site, type, age, and sex. In addition to the NENs by site visualisations referred to in the above paper, NENs statistics by site/type/age/sex are available within the Cancer by histology visualisations. For different cancers, the survival rates and incidence rates may vary considerably by histology. Within the Cancer by histology visualisation, the NENs incidence and survival are provided alongside other cancer types (by histology) for selected cancers.