Entries, exits and transfers

Key findings

  • There were 32,400 households newly allocated social housing in 2022–23.
  • Around 12,800 new social housing allocations were to greatest need households who were experiencing homelessness. 
  • Almost two thirds of newly allocated public housing households had special needs.
  • Households in greatest need spent less time on waiting lists than other households.
  • Exits from public housing and SOMIH decreased compared to previous years.

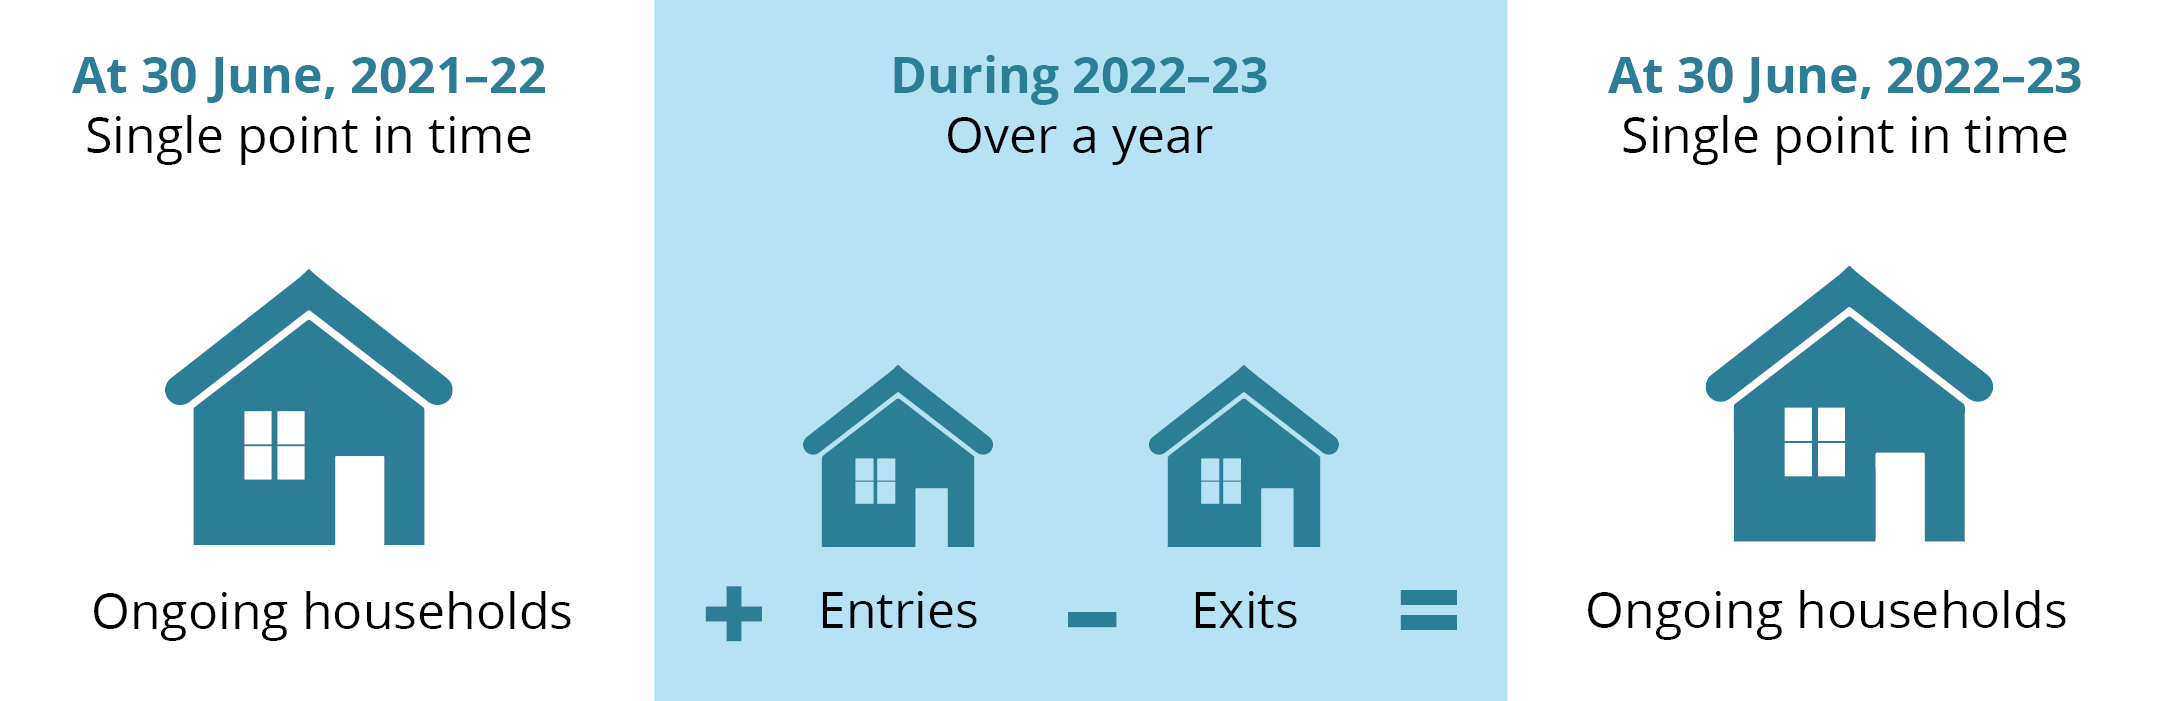
During a collection period, people may be allocated social housing, exit a social housing program, or move from one social housing dwelling to another within the same program (Figure ENTRIES.1). This section presents key data on these entries, exits and transfers.

Data on entries, exits and transfers for Indigenous community housing were not available.

Figure ENTRIES.1: Entries, exits and ongoing households

Entries, exists and ongoing households. The diagram shows the relationship between ongoing households at a single point in time (at 30 June 2021–22), households entering and exiting social housing over a year (during 2022–23) and ongoing households at a single point in time (at 30 June 2022–23).

Households entering social housing

There were 32,400 households newly allocated social housing in 2022–23.

The total number of newly allocated households (also referred to as new entries) in 2022–23 increased to 32,400 compared with 31,700 in 2021–22 across public housing, community housing and SOMIH (Table HOUSEHOLDS.10).

Of the 32,400 new allocations, approximately half were allocated public housing (51% or 16,500 households), 47% were allocated community housing (15,200 households) and 2.2% to SOMIH (700 households), similar to the stock profiles of each housing program.

In recent years, the number of new entries into public housing has been declining, reflecting the declining dwelling stock. For Queensland and South Australia, the number of new allocations in 2022–23 were fewer than all years since 2013–14 (Figure ENTRIES.2, Table HOUSEHOLDS.10). In contrast, the number of new entries into community housing has remained relatively stable in recent years, in part due to dwellings transfers from public housing and SOMIH to community housing (Figure ENTRIES.2, Table HOUSEHOLDS.10).

For SOMIH, the number of newly allocated households has fluctuated over time, in 2022–23, 700 households were newly allocated (Figure ENTRIES.2; Table HOUSEHOLDS.10).

Figure ENTRIES.2: Ongoing households, newly allocated households and exited households, by social housing program, 2011–12 to 2022–23

Ongoing, newly allocated and exited households, by public housing and SOMIH, in 2011–12 to 2022–23. This line graph shows the changes in newly allocated entries, ongoing and exits households from 2011–12 to 2022–23 for public housing and SOMIH. Ongoing households in public housing decreased from 323,400 in 2011–12 to 286,300 in 2022–23 while SOMIH increased from 9,700 in 2011–12 to 13,100 in 2022–23. For public housing, newly allocated households declined from 21,400 in 2011–12 to 16,500 in 2022–23.

Characteristics of newly allocated households

Newly allocated public housing households were mostly single adult (57%) households during 2022–23. Other key characteristics of newly allocated households in public housing for 2022–23 included (Table HOUSEHOLDS.12):

  • The main tenant was female in over half (57%) of the households.
  • Over 1 in 4 (27%) households included an Indigenous household member.
  • For 1 in 3 (32%) households, the main tenant was aged 55 and over.
  • Over a third (34%) of households had a member with disability.

For SOMIH, newly allocated households during 2022–23 were more likely to be group and mixed composition households (41%) followed by sole parent with dependent children households (32%). In contrast to public housing, with 57% being single adults, only 11% of newly allocated households in SOMIH were single adults (Table HOUSEHOLDS.12).

While proportions for each measured characteristic did have some degree of variation between states, all states followed the same general trends for both public housing and SOMIH.

Data on the characteristics of newly allocated households for community housing and Indigenous community housing were not available.

Housing features of new allocations

Housing features of new allocations differed between public housing and SOMIH. The different profiles of new allocations by housing features partly reflect the differences in the types of dwelling type stock available within the programs (see Dwelling attributes).

In 2022–23, newly allocated households in the public housing program were more likely to be dwellings with fewer bedrooms (40% were 1 bedroom, 33% were 2 bedrooms, 23% were 3 bedrooms and 4.3% were 4 or more bedrooms) compared to SOMIH (3.6% were 1 bedroom, 24% were 2 bedrooms, 50% were 3 bedrooms and 22% were 4 or more bedrooms) (Table HOUSEHOLDS.14).

Priority groups

Allocation to social housing is determined by policies regarding eligibility, priority groups and entitlement (such as type and location of the property) (Powell et al. 2019). Although income remains the primary eligibility factor for social housing allocation, allocations are also based on an applicant’s circumstances, that is, their need for social housing relative to others on the waiting list (Pawson et al. 2020).

While social housing allocations were historically targeted towards households with a lower income, over time, social housing policies have increasingly focused on supporting vulnerable and complex need applicants, such as applicants experiencing trauma, disadvantage and/or financial instability (Groenhart et al. 2014; Pawson et al, 2020).

As a result, social housing is generally allocated according to priority needs, with allocations made based on identifying those people with the greatest need (such as applicants experiencing homelessness) and those with special needs for housing assistance (such as applicants with disability).

Data on greatest need status for Indigenous community housing were not available.

Greatest need households

Public housing, SOMIH and community housing programs prioritise household allocations through priority waiting lists, such as the greatest need waiting list. The criteria for priority needs varies between jurisdictions, so any comparisons between states and territories must be exercised with caution.

Special needs households

Households seeking social housing often have members with special needs. Some households may have one or more members with multiple special needs. The definition of special needs differs across the different social housing programs and between jurisdictions.

For more information about how households are prioritised, see the technical notes.

New allocations for greatest need households

Around 12,800 new social housing allocations were to greatest need households who were experiencing homelessness.

Greatest need households accounted for 83% (or 13,600 households) of all newly allocated public housing households in 2022–23 (Figure ENTRIES.3; Table HOUSEHOLDS.15).

Figure ENTRIES.3: Newly allocated households by greatest need status and social housing program, 2009–10 to 2022–23

Newly allocated households, by greatest need status and social housing program, 2009–10 to 2022–23. This vertical stacked bar graph shows, for public housing, community housing and SOMIH, there were more newly allocated greatest needs households than other households, from 2009–10 to 2022–23. In 2022–23, most new public housing allocations were provided to households in greatest need (83%). In 2009–10, 71% of newly allocated SOMIH dwellings were provided to households in greatest need; this increased to 81% in 2022–23. Housing allocations to greatest needs households in community housing was 77%.

Over 4 in 5 (81% or 230) of newly allocated SOMIH households were households with greatest need status in 2022–23 (excludes Tasmania and the Northern Territory, as greatest need data were not available) (Figure ENTRIES.3; Table HOUSEHOLDS.15). The variation over time in the proportion of newly allocated SOMIH households with greatest need status reflects changes in the total number of newly allocated households in SOMIH.

Main reason for greatest need

In 2022–23, of the 13,600 newly allocated public housing households in greatest need (Figure ENTRIES.4; Table HOUSEHOLDS.16):

  • 54% (7,400 households) were experiencing homelessness at the time of allocation; up from 47% in 2018–19.
  • 36% (4,800 households) were at risk of homelessness, of those households:
    • Almost 3,100 reported the main reason for their greatest need was because their life or safety was at risk in their accommodation.
    • 1,500 households reported a health condition aggravated by housing as their main reason for greatest need.

Figure ENTRIES.4: Newly allocated households in greatest need by main reason for greatest need and social housing program, 2011–12 to 2022–23

Newly allocated households in greatest need, by main reason for greatest need and social housing program, 2011–12 to 2022–23. This line graph shows the main reason for greatest need of newly allocated households. In 2011–12, the main reason for greatest need in public housing was homelessness (55%); this decreased to 54% in 2022–23. Of those at risk of homelessness in public housing in 2011–12, the most common reason for greatest need was because their health condition was aggravated by housing (15%); in 2022–23, the most common reason was because their life or safety was at risk in accommodation (23%).

Data on the main reason a household was in greatest need is not collected for community housing. Based on available data, in 2022–23, more newly allocated greatest need community housing households were at risk of homelessness (49%) than experiencing homelessness (45%) (Figure ENTRIES.4; Table HOUSEHOLDS.16).

New allocations for special needs households

Almost two thirds of newly allocated public housing households had special needs.

Data on special needs were available for public housing, SOMIH and community housing. A household may have more than one special needs reason. In 2022–23, there were 10,300 newly allocated public housing households with special needs, representing 62% of all newly allocated households. Of these (Table HOUSEHOLDS.18):

  • 5,600 households had at least one member with disability
  • 4,500 households had at least one Indigenous member
  • 1,600 households had a main tenant aged under 25
  • 800 households had a main tenant aged 75 or over.

In 2022–23, of the 300 newly allocated SOMIH households with special needs:

  • 190 households had a main tenant aged 50 and over
  • 60 households had a main tenant aged under 25 years
  • 100 households contained at least one member with disability.

Greatest and special needs households

Greatest and special needs categories are not mutually exclusive, as one or more household members may be eligible within each priority group and between priority groups. Households with members in both greatest and special needs groups may be some of the most vulnerable households and may require high levels of care and support.

In 2022–23, of the newly allocated households in public housing (Figure HOUSEHOLDS.4; Table HOUSEHOLDS.17):

  • half (54% or 8,800 households) were both greatest need and special needs households
  • 1 in 5 (22% or 3,600 households) were greatest need only (no special needs)
  • 5.3% (900) were neither greatest need nor special needs households.

In 2022–23, of the newly allocated households in SOMIH:

  • around 1 in 6 (15% or 105 households) were both greatest need and special needs households
  • almost 1 in 5 (18% or 125 households) were greatest need only (no special needs)

Note that greatest need information for SOMIH was unavailable for Tasmania and the Northern Territory.

Time waited for social housing allocation

Households in greatest need spent less time on waiting lists than other households.

The time waited by applicants is influenced by dwelling availability (including the size of dwelling needed) and priority group status (greatest need or special needs) (Powell et al. 2019). Since households with priority status (such as people experiencing homelessness or a disability) are placed ahead of households without priority status, the number of households with priority status may influence the amount of time waited for social housing allocation. Additionally, the time waited for social housing programs can vary both between and within jurisdictions, as the time waited for social housing in high demand city areas are often far greater than other areas (NSW Government 2018; Powell et al. 2019).

Data on time waited for housing allocation were unavailable for both community housing and Indigenous community housing. See the technical notes for more information on the method used to calculate time waited.

In 2022–23 (Table HOUSEHOLDS.21)

  • Of all newly allocated public housing households:
    • 2 in 5 (40%) households were allocated housing within 1 year; 47% waited 1 to 5 years and 13% waited 5 years or more for housing allocation.
    • Almost one third of households without children were allocated housing in less than 6 months (31% for single adults and 28% for couples only households).
  • Of all newly allocated SOMIH households:
    • Over half (54%) of newly allocated households received housing in less than 1 year; 34% waited 1 to 5 years and 12% waited 5 or more years for housing allocation.
    • Group and mixed composition households were allocated housing the fastest, with over half (58%) securing housing in less than 6 months.

Greatest need and time waited for housing allocation

In 2022–23, among newly allocated households (Figure ENTRIES.2, Table HOUSEHOLDS.19):

  • For public housing, greatest need households were more likely to be allocated housing within a year.
    • Over half of greatest need households (57%, or 7,800 households) received housing within one year, compared to 40% (1,100) of households without greatest need status.
    • The proportion of newly allocated greatest need households receiving housing who waited less than 3 months (29%) for housing allocation was higher than households without greatest need status (24%).
  • Households without greatest need status were more likely to spend 2 years or more on the waiting list before receiving a public housing allocation (45% or 1,300), compared to households with greatest need status (24% or 3,300).

For SOMIH, newly allocated households with greatest need status were generally allocated housing faster than households without. In 2022–23 (Figure ENTRIES.5; Table HOUSEHOLDS.19):

  • Almost 2 in 3 (or 63%) of newly allocated SOMIH households in greatest need waited less than 1 year.
  • Around one third (or 31%) of newly allocated SOMIH households without greatest need status waited less than 1 year.

Figure ENTRIES.5: Time waited by newly allocated households by greatest need status and public housing and SOMIH, 2022–23

Time waited of newly allocated households, by greatest need status for public housing and SOMIH, 2022–23. The stacked bar graph shows the highest number of newly allocated greatest need household in both public housing (4,000) and SOMIH (75) waited less than 3 months before being allocated housing. For public housing (690) the highest number of newly allocated other households waited between 2 years and less than 5 years to be allocated housing. Similarly, for SOMIH, almost 2 in 5 (39%) waited between 2 and less than 5 years to be allocated housing.

Special needs and time waited

Households seeking assistance from social housing providers often have members with special needs. Some households may have multiple special needs. The definition of special needs is different for different social housing programs. For more detailed information, see the Technical notes.

In 2022–23, the time special needs households waited for an allocation of public housing varied, around (Table HOUSEHOLDS.20):

  • 1,700 (17%) households waited for less than 3 months
  • 2,300 (22%) households waited between 3 months and less than 1 year
  • 4,900 (48%) households waited between 1 year to less than 5 years, and
  • 1,300 (or 13%) households waited for more than 5 years.

Number of bedrooms and time waited

The time waited for social housing allocation varied depending upon the number of bedrooms required by a household and by program. For public housing, the amount of time waited was similar regardless of the number of bedrooms. For SOMIH, 44% of households requiring 4 or more bedrooms waited less than 3 months (Table HOUSEHOLDS.22).

Households exiting social housing

Exits from public housing and SOMIH decreased compared to previous years.

Social housing 'Exits' refers to households that have exited a specific housing program during the reference year. Households that relocate within the same housing program are not considered ‘exits’ but are instead known as ‘transfers’. Note: this definition may wary across states and territories, see Technical notes for details.

Households may exit social housing for a variety of reasons. Some households exit because of changes to their housing or neighbourhood needs, such as those related to location, size, or neighbourhood safety (Johnson et al. 2019). Whereas others exit social housing for financial or forced reasons, including employment opportunities, entry into home ownership, eviction, or ineligibility due to an increase in income (Baker et al. 2020, 2021). In this way, reasons influencing households exits from social housing can be both positive and negative (Wiesel et al. 2014). While exiting households most commonly enter the private rental market, some also enter home ownership or other tenure types, such as employer provided housing (Baker et al. 2020, Bentley et al. 2018). This information is not captured in the datasets informing this report.

In 2022–23, exits from public housing decreased compared to previous years, with around 16,200 public housing households exiting. Both SOMIH and community housing saw increases in exits, with 1,200 SOMIH households and 12,900 community housing households having exited in 2022–23 (Table HOUSEHOLD.23).

Across the states and territories, Queensland (3,100 entries and 2,800 exits) and Western Australia (2,900 entries and 2,100 exits) were the only states to have had more new allocations to public housing than exits from public housing (Tables HOUSEHOLDS.10 and 25).

The number of households in Australia exiting SOMIH (1,200) in 2022–23 was higher than the number of newly allocated households (700).

Households transferring dwellings

Transfers occur when occupants move to a dwelling in the same social housing program, see Technical notes for state/territory variations on this definition.

Transfers may be initiated by either the tenant (including a mutual swapping of properties between eligible tenants) or housing provider in response to a change in circumstance or housing need. This may include household composition changes (such as overcrowding or underutilisation), a medical condition or because of stock renewal and re-development. Transfer eligibility and implementation varies by jurisdiction and housing program.

During 2022–23, 7,000 (2.3%) of public housing households and 360 (2.5%) of SOMIH households transferred – or were relocated – to a different dwelling within the same housing program (Table HOUSEHOLDS.25).

Figure TRANSFERS AND EXITS.1: Households by transfer and exit status, public housing and SOMIH, by states and territories, 2013–14 to 2022–23

Households by transfer and exit status, by public housing and SOMIH, 2011–12 to 2022–23. This vertical bar graph shows that nationally the number of public housing and SOMIH households that exited were higher than those that transferred, from 2011–12 to 2022–23. In 2011–12, 22,900 public housing households exited, and 8,200 households transferred; in 2022–23, households that exited decreased to 16,200 and households that transferred decreased to 7,000. In 2011–12, around 600 SOMIH households exited and 300 transferred; in 2022–23, households that exited increased to 1,200, while those that transferred remained around 300 (360 in 2022–23).