User guide
The data cubes can be used to explore a range of clinical data related to hospital separations. This document will provide some tips on how to utilise the data cubes generally and how to deal with the different formats in which the cubes are provided.
For older years, hospitals data cubes are available in the SAS cubes software. Hospitals data cubes have been made available in excel format in more recent years. The guide for extraction of information from these cubes depends on the format in which they are available.
Hospitals data cubes in Excel
The excel data cube workbooks consist of two sheets:
- 5-character PDx Counts Data contains separation statistics by principal diagnosis by age group by sex by same-day status.
- 5-character PDx Counts Summary contains a pivot table showing separation statistics by principal diagnosis. This pivot table can be modified to various levels by right clicking on the table, selecting ‘Show Field List’, and then modifying the pivot table as desired (see Figure 1).
- Variables in the ROWS list can be removed to disaggregate at higher levels.
- Variables such as age group, sex and/or same-day flag can be dragged to the COLUMNS list to disaggregate by these variables.
Figure 1: 5-character PDx counts summary pivot table
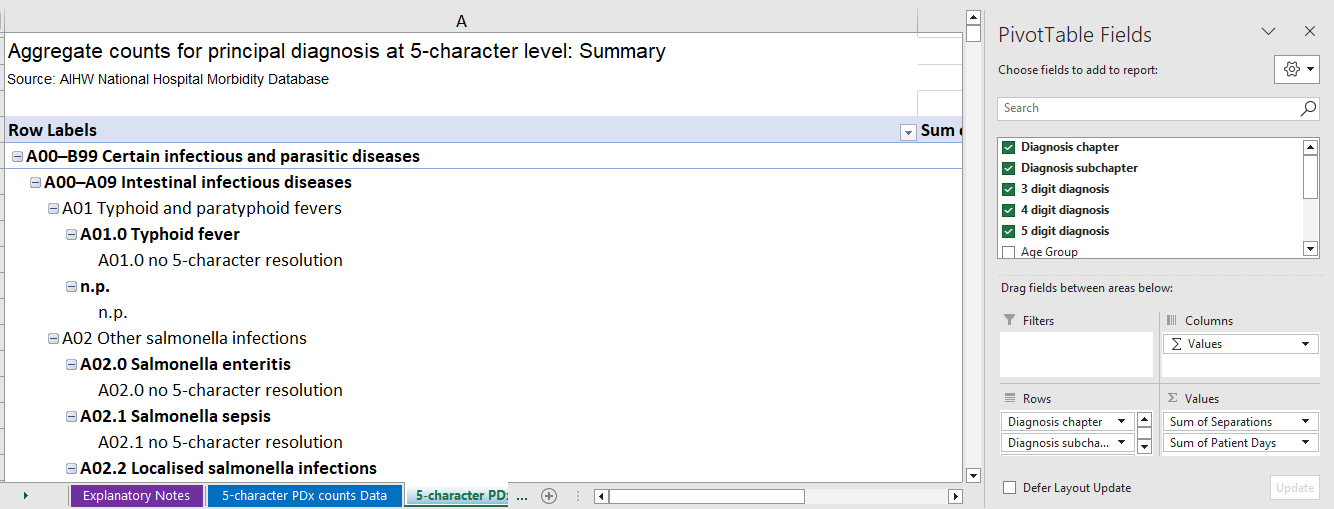
Source: Separation statistics by principal diagnosis (ICD-10-AM 11th edition), Australia, 2021-22 data cube.
The cubes contain information on the number of separations and number of patient days. Once the cube has been aggregated/disaggregated to the desired level, average length of stay can be calculated as number of patient days/number of separations.
Hospital data cubes in SAS
These data cubes will open in a new window. Data will be displayed at the most aggregated level, as in Figure 2:
Figure 2: Data cube aggregate view
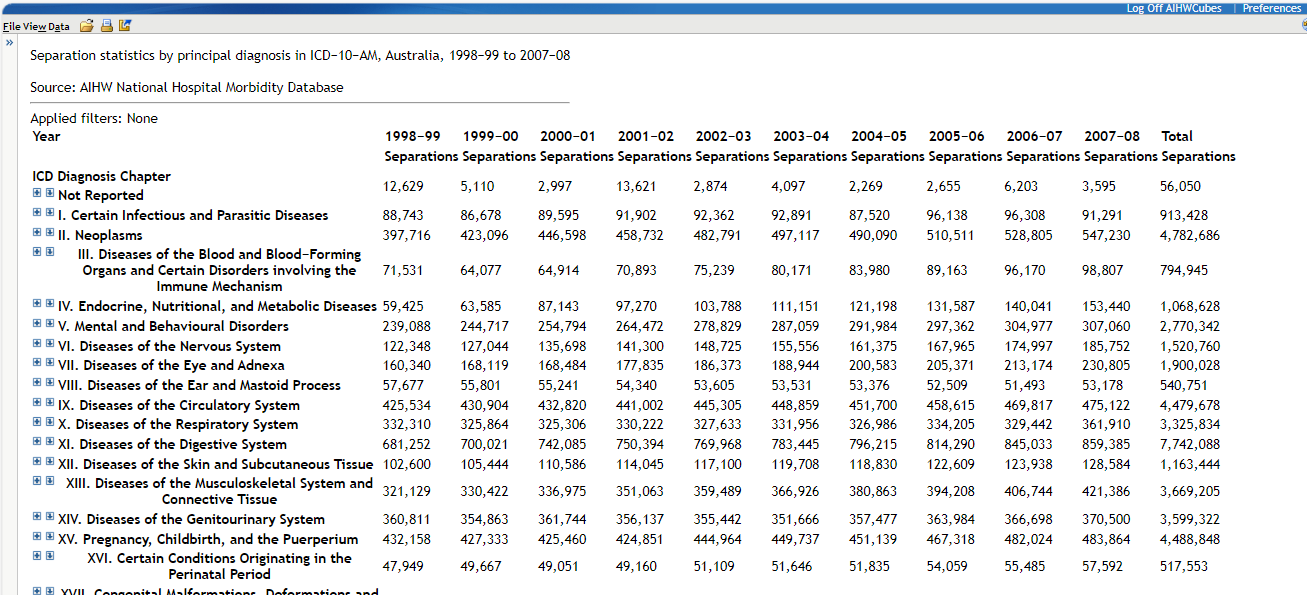
Source: Separation statistics by principal diagnosis in ICD-10-AM, Australia,1998-99 to 2007-08 data cube.
Expanding categories and sub-categories
Clicking on the plus (+) symbols against each row will expand that item into its relevant sub-categories, within the current view.
Clicking the arrow symbols beside the plus will expand the category and also limit the view to just that expanded area of interest.
Right clicking on category headings such as ICD Diagnosis Chapter will bring up a menu where you can click ‘Expand All’, which will expand every item in that list (see Figure 3). If you also do this with the subchapter and other headings, you can expand out the entire data cube and display all of the available information.
Figure 3: Expand data cube principal diagnosis chapters
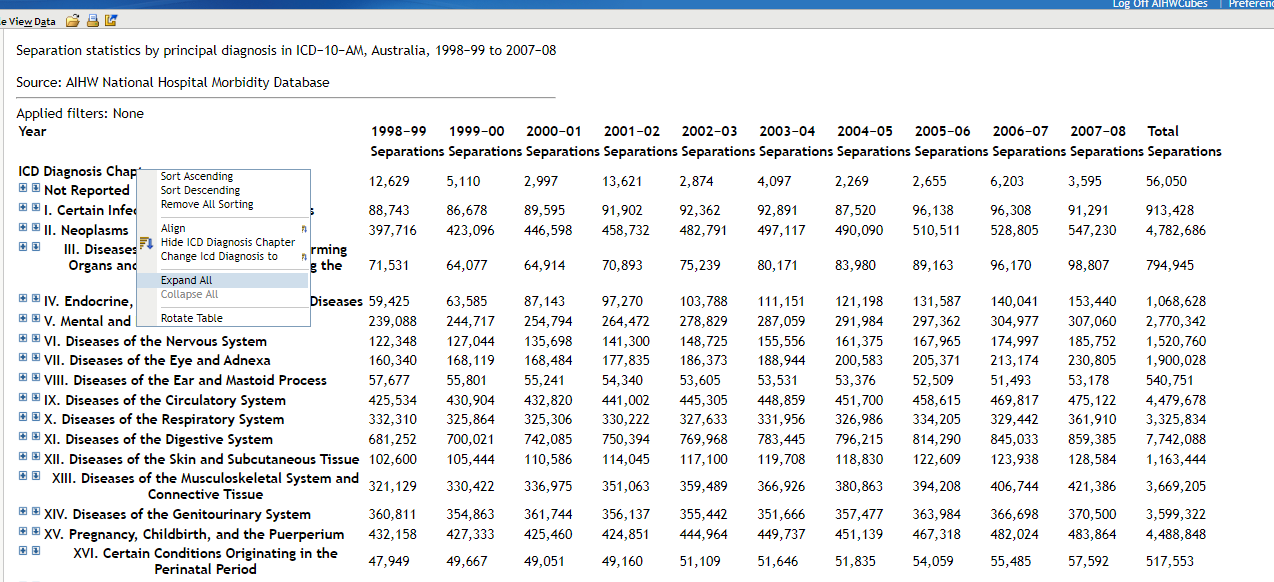
Source: Separation statistics by principal diagnosis in ICD-10-AM, Australia,1998-99 to 2007-08 data cube.
Adding breakdowns
In the default view, the cube will just present the number of hospital separations by year, but you can also add other breakdowns such as by Age group, sex, and include patient days or average length of stay.
To add an extra breakdown, right click on one of the numbers in the cube and choose ‘Assign data’ (Figure 4).
Figure 4: Assign data option
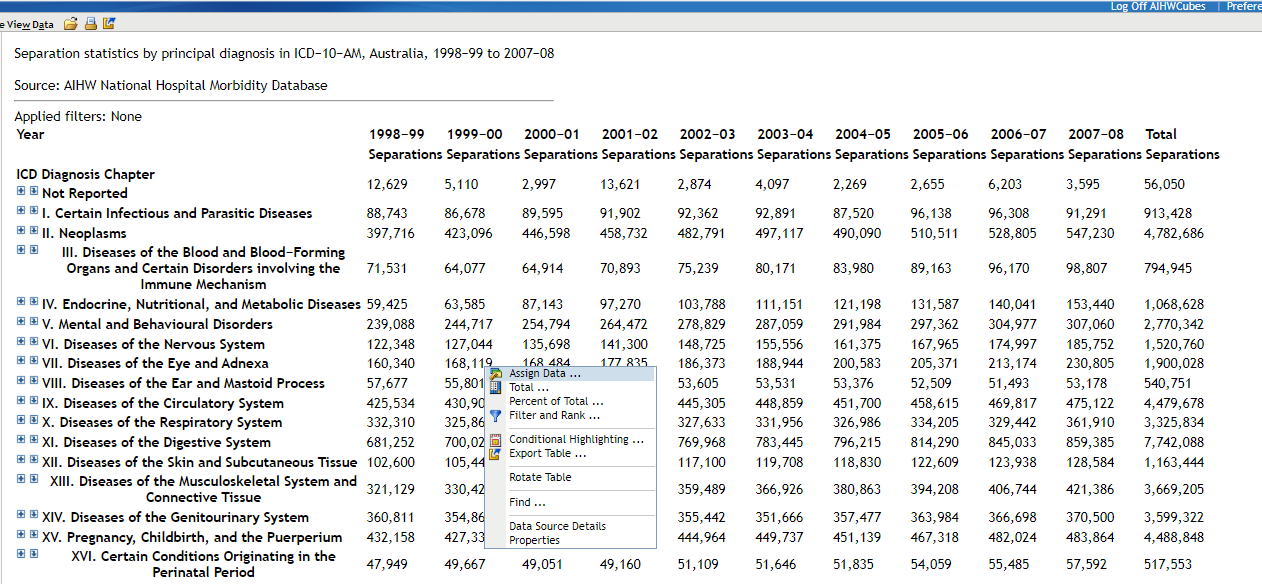
Source: Separation statistics by principal diagnosis in ICD-10-AM, Australia,1998-99 to 2007-08 data cube.
Then choose which variables to add to rows or columns of the cube (Figure 5).
Figure 5: Assigning data
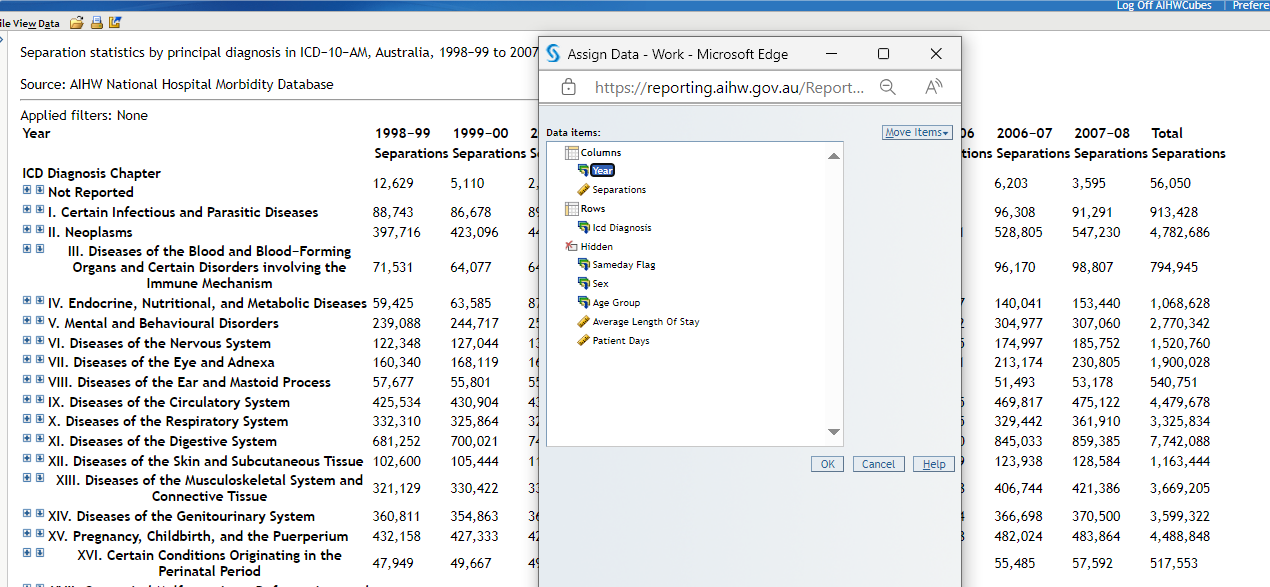
Source: Separation statistics by principal diagnosis in ICD-10-AM, Australia,1998-99 to 2007-08 data cube.
Exporting data to Excel
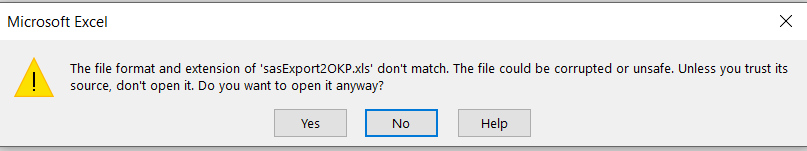
The current view of the data cube can easily be exported to Excel by choosing ‘Export…’ from the ‘File’ menu, and then saving the file to your computer. The cube will be extracted in an old version of excel in .xls format. The export can be opened by choosing yes if the following dialogue box appears:
Exporting the whole data cube
To do this, first see the notes about Expanding the categories and sub categories first and using Expand All. Then once you have the full view of the cube, export the data as per the step above.
Tips on using the Principal Diagnosis data cube
Note that the use of the different ICD editions in the data cubes over time means that data across years may not be exactly comparable.
Within the cubes, users can view the diagnoses by working down from the broad chapter level in the ICD classifications to more specific categories (i.e. principal diagnosis code), as illustrated below:
- ICD Chapter
- ICD Sub-Chapter
- ICD 3-character code
- ICD 4-character code (where relevant)
- ICD 5-character code (where relevant)
- ICD 4-character code (where relevant)
- ICD 3-character code
- ICD Sub-Chapter
For example:
- Endocrine, nutritional and metabolic diseases (E00-E89)
- Disorders of thyroid gland (E00-E07)
- Other hypothyroidism (E03)
- Congenital hypothyroidism without goitre (E03.1).
- Other hypothyroidism (E03)
- Disorders of thyroid gland (E00-E07)
Users of the data cubes are likely to require some familiarity with ICD-9-CM and ICD-10-AM and can also refer to the Australian Hospital Statistics publications. Users will generally need to know what chapter the information they are looking for is in, to work down to more specific levels of detail. More information about the breakdowns and categories used within the data cube are given below.
International Classification of Diseases (ICD)
Principal diagnoses are classified according to either the International Classification of Diseases, 9th Revision, Clinical Modification (ICD-9-CM) or the International Statistical Classification of Diseases and Related Health Problems, Tenth Revision, Australian Modification (ICD-10-AM). The use of the different classifications (ICD-9-CM and ICD-10-AM) in the data cubes means that data from 1998–99 onwards may not be exactly comparable with the earlier data (1993-94 to 1997-98). In addition, there are some differences in the coding between ICD-10-AM editions and these will be reflected in the cube.
The following is a list of the ICD disease chapters used in the data cube and the code ranges covered by each:
Chapter | Disease classification | Code range |
|---|---|---|
1 | Certain infectious and parasitic diseases | A00–B99 |
2 | Neoplasms | C00–D48 |
3 | Diseases of the blood and blood-forming organs and certain disorders involving the immune mechanism | D50–D89 |
4 | Endocrine, nutritional and metabolic diseases | E00–E89 |
5 | Mental and behavioural disorders | F00–F99 |
6 | Diseases of the nervous system | G00–G99 |
7 | Diseases of the eye and adnexa | H00–H59 |
8 | Diseases of the ear and mastoid process | H60–H95 |
9 | Diseases of the circulatory system | I00–I99 |
10 | Diseases of the respiratory system | J00–J99 |
11 | Diseases of the digestive system | K00–K93 |
12 | Diseases of the skin and subcutaneous tissue | L00–L99 |
13 | Diseases of the musculoskeletal system and connective tissue | M00–M99 |
14 | Diseases of the genitourinary system | N00–N99 |
15 | Pregnancy, childbirth and the puerperium | O00–O99 |
16 | Certain conditions originating in the perinatal period | P00–P96 |
17 | Congenital malformations, deformations and chromosomal abnormalities | Q00–Q99 |
18 | Symptoms, signs and abnormal clinical and laboratory findings, not elsewhere classified | R00–R99 |
19 | Injury, poisoning and certain other consequences of external causes | S00–T98 |
20 | External Causes of Morbidity and Mortality | U50–U73, V00-Y98 |
21 | Factors influencing health status and contact with health services | Z00–Z99 |
| 22 | Codes for special purposes | U00–U49, U75–U88, U91–U93 |