Services and activity
In 2017–18:
- Procedural clinics accounted for 8% of service events (3.1 million) (Table 9). Most major hospitals—Principal referral and women’s and children’s hospitals, Public acute group A hospitals and Public acute group B hospitals—reported service events for at least one of these clinics
- Medical consultation clinics accounted for 31% of service events (12.2 million). All major hospitals reported service events for at least one of these clinics
- Diagnostic services accounted for 15% of service events (5.8 million). Victoria did not report information for Diagnostic services (see Appendix A for more information)
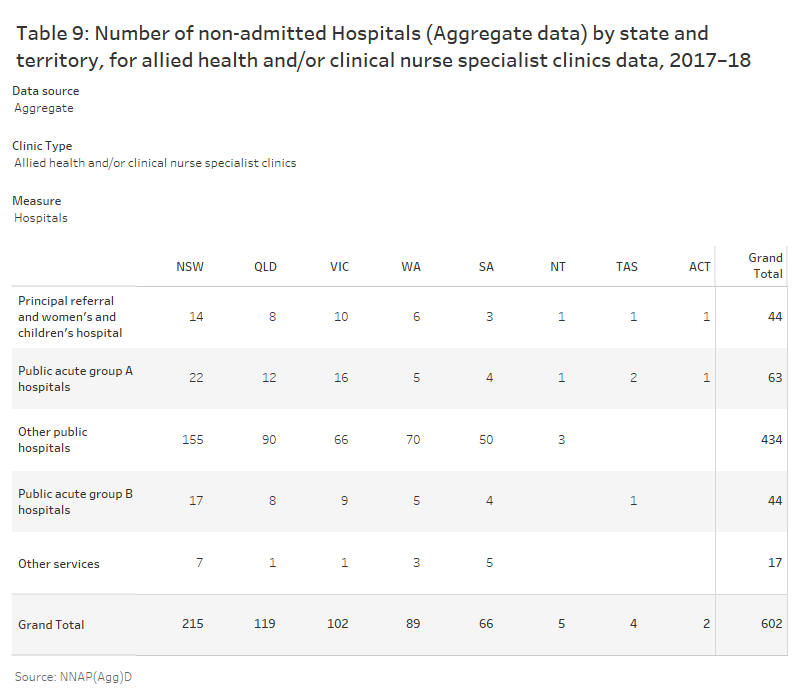
- Allied health and/or clinical nurse specialist intervention clinics accounted for 46% of service events (17.8 million). All major hospitals reported service events for at least one of these clinics. About 22% of these service events were provided by smaller hospitals.
The majority of group service events (95%) occurred in Allied health and/or clinical nurse specialist intervention clinics.
The proportion of service events that occurred in different types of hospitals varied across jurisdictions.
Data visualisation of table 9
See Tables 3.1 to 3.6 and Tables S3.1 to S3.9 for caveat information related to these data. Available to download from the Data section.