Back problems

Page highlights

What are back problems?

‘Back problems’ describes a range of conditions related to the bones, joints, connective tissues, muscles and nerves of the back.

How common are back problems?

Around 4.0 million (16%) people in Australia were estimated to be living with back problems in 2022.

Impact of back problems

  • Back problems were the third leading cause of disease burden overall, accounting for 4.3% of Australia’s total disease burden in 2023.
  • In 2020–21, an estimated $3.4 billion was spent on the treatment and management of back problems, representing 2.2% of total health system expenditure and 23% of expenditure for all musculoskeletal conditions.
  • Back problems contributed to 1,112 deaths or 4.3 deaths per 100,000 population in 2022 (0.6% of all deaths). 

Treatment and management of back problems

In 2021–22, there were 177,000 hospitalisations with a principal diagnosis of back problems (690 hospitalisations per 100,000 population).

Comorbidities of back problems

In 2022, 72% of people with back problems were estimated to be living with one or more other chronic conditions – the top 3 comorbidities were mental and behavioural conditions (43%), arthritis (34%) and asthma (17%).

What are back problems?

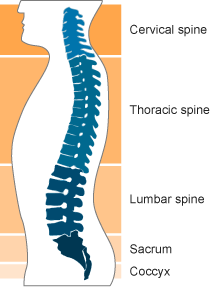
'Back problems’ describes a range of conditions related to the bones, joints, connective tissue, muscles and nerves of the back. These conditions can affect the neck (cervical spine), upper back (thoracic spine) and lower back (lumbar spine) as well as the sacrum and tailbone (coccyx) (Figure 1). Examples of back problems include:

  • back or spine pain (such as lower back pain, and sciatica)
  • vertebrae and disc disorders (such as narrowing of the spinal canal, and disc degeneration)
  • deforming disorders (such as scoliosis).

Figure 1: Lateral view of spine

This figure shows the 5 regions of the spine - cervical spine, thoracic spine, lumbar spine, sacrum and coccyx.

How common are back problems?

Around 4.0 million (16%) people in Australia were estimated to be living with back problems, according to self-reported data in the 2022 Australian Bureau of Statistics (ABS) National Health Survey (NHS) (ABS 2023). Back problem prevalence increased with increasing age and was similar for males and females.

Note: Unless otherwise stated, crude rates are presented for prevalence in this report and as such, these rates have not been adjusted to account for differences in the age structures of different populations. Care should therefore be taken before making comparisons between populations using these data.

In 2022, people:

  • living in Inner and Outer regional areas were more likely to be living with back problems compared with those living in Major cities (17% and 15%, respectively)
  • living in areas of most disadvantage (lowest socioeconomic areas) were more likely to be living with back problems compared with people living in the least disadvantaged areas (highest socioeconomic areas) (18% and 13%, respectively)
  • with a disability were 4 times as likely to be living with back problems compared with people without a disability (32% and 8%, respectively) (ABS 2023).

After adjusting for different population age structures over time, the prevalence of back problems decreased from 21% in 2001 to 15% in 2022 (Figure 2) (ABS 2023).

Figure 2: Prevalence of back problems, by age and sex, over time (2001 to 2022), by population group, 2022

This figure shows that the prevalence of back problems was highest in males aged 55–74.

Prevalence in Aboriginal and Torres Strait Islander (First Nations) people

The Australian Institute of Health and Welfare (AIHW) uses ‘First Nations people’ to refer to Aboriginal and/or Torres Strait Islander people in this report. 

Around 102,200 (13%) First Nations people were estimated to have back problems in 2018–19, based on the National Aboriginal and Torres Strait Islander Health survey (NATSIHS), down from 15% in 2001 (ABS 2019).

Impact of back problems

Back problems can have a big impact on quality of life, both physically and emotionally. They can be the cause of acute and chronic pain, burden in other health domains, including physical limitation that involves loss of participation and withdrawal from usual social, community, and occupational activities, as well as decreased quality of life and well-being, including mental well-being (Briggs et al. 2016).

Measures of impact covered in this section include burden of disease, health expenditure and mortality data.

Burden of disease

In 2023, back problems were the third leading cause of burden and accounted for 4.3% of total burden (also known as disability-adjusted life years or DALY), 7.9% of non-fatal burden (years lived with disability or YLD), and less than 1% of fatal burden (years of life lost or YLL). 

Within the musculoskeletal condition disease group, back problems accounted for:

  • 34% of total burden (DALY)
  • 34% of non-fatal burden (YLD)
  • 6.0% of fatal burden (YLL) (AIHW 2023a).

In 2023, the rate of burden from back problems increased with increasing age and was similar for males and females (Figure 3). Back problems were the leading cause of burden for people aged 35–54.

After adjusting for different population age structures over time, the rate of burden from back problems changed little (8.0 to 8.6 DALY per 1,000 population) between 2003 and 2023.

For more information, see Australian Burden of Disease Study 2023.

Figure 3: Burden of disease due to back problems, by age and sex, 2003, 2011, 2015, 2018 and 2023

This figure shows that both fatal and non-fatal burden were similar for males and females in 2023.

Variation between population groups

In 2018, after adjusting for age differences, the rate of burden from back problems:

  • was highest in Inner regional areas and lowest for people living in Remote and Very remote areas (9.3 and 5.9 DALY per 1,000 population, respectively)
  • was highest for people living in areas of most disadvantage (lowest socioeconomic areas) and lowest for people living in the least disadvantaged areas (highest socioeconomic areas) (9.6 and 7.0 DALY per 1,000 population, respectively) (Figure 4) (AIHW 2021).

For more information, see Australian Burden of Disease Study 2018: Interactive data on disease burden.

Figure 4: Burden of disease due to back problems for remoteness area and socioeconomic area by sex, 2011, 2015 and 2018

This figure shows the rate of non-fatal burden from back problems was highest for people living in ‘Inner regional’ areas in 2018.

Health system expenditure

In 2020–21, an estimated $3.4 billion of expenditure in the Australian health system was attributed to back problems, representing 2.2% of total health expenditure and 23% of expenditure for all musculoskeletal conditions (AIHW 2023b).

Where is the money spent?

In 2020–21:

  • hospital services represented 66% ($2.2 billion) of back problems expenditure which was similar the hospital proportion for all disease groups (63%). However, the private hospital proportion of back problems expenditure was more than double the proportion for all disease groups (41% compared with 17%)
  • primary care accounted for 19% ($650.5 million) of back problems spending, which was less than the proportion for all disease groups (28%)
  • referred medical services represented 15% ($499.3 million) of back problems expenditure 1.5 times more than the proportion for all disease groups (10%). The medical imaging proportion of back problems expenditure was especially large in comparison to the average, at 3.9 times the proportion for all disease groups (12% compared with 3%) (Figure 5).

Figure 5: Back problems expenditure attributed to each area of the health system, with comparison to all disease groups, 2020–21

This figure shows that the public hospital admitted patients’ proportion of back problems expenditure was $435 million (12.9%) in 2020-21.

In 2020–21, back problems accounted for:

  • 8.7% ($396.5 million) of all medical imaging expenditure – ranking third of all diseases/conditions
  • 5.5% ($1.4 billion) of all private hospital service expenditure – ranking third of all diseases/conditions (Figure 6).

Figure 6: Proportion of expenditure attributed to back problems, for each area of the health system, 2020–21

This figure shows that 4.8% of back problem expenditure was attributed to allied health and other services.

Who is the money spent on?

In 2020–21:

  • the age distribution of spending on back problems reflected the prevalence distribution of the condition, with most spending being for older age groups (76% for people aged 45 and over)
  • more back problems expenditure was attributed to females than males ($1.8 billion and $1.5 billion, respectively with a remaining $46.3 million (1.4%) unattributed to any sex.

In 2018–19, it was estimated that back problems expenditure per case was:

  • 13% as high for females compared with males ($860 and $760 per case, respectively)
  • 32% lower than musculoskeletal conditions as a group ($820 and $1200 per case, respectively) (AIHW 2022).

For more information, see:

How many deaths were associated with back problems?

Back problems were recorded as an underlying and/or associated cause for 1,112 deaths or 4.3 deaths per 100,000 population in 2022. This represented 0.6% of all deaths and 11% of all musculoskeletal deaths in 2022.

Back problems were the underlying cause for 117 deaths (11% of all back problem deaths) and an associated cause only, for 995 deaths (89% of all back problem deaths).

After adjusting for different population age structures over time, mortality rates for back problems (as the underlying and/or associated cause) between 2012 and 2022:

  • increased from 2.3 to 3.3 per 100,000 population
  • were similar for males and females (Figure 7).

Figure 7: Trends over time for back problems mortality, 2012 to 2022

This figure shows that between 2012 and 2022, death rates (underlying and/or associated cause) due to back problems were highest in 2022 and lowest in 2013 and 2014.

Variation between population groups

In 2022, after adjusting for age differences, back problem mortality rates (underlying and/or associated cause) were:

  • similar across remoteness areas (highest for people living in Inner regional and Outer regional areas, and lowest for people living in Major cities (3.8, 3.8 and 3.1 deaths per 100,000 population, respectively)
  • higher for people living in areas of most disadvantage (lowest socioeconomic areas) compared with people living in the least disadvantaged areas (highest socioeconomic areas) (4.1 and 2.5 deaths per 100,000 population, respectively).

Treatment and management of back problems

Pain is the main symptom of most back problems and treatment can be complex. This can be further complicated by comorbid conditions. 

The most recent Australian clinical practice guidelines for management of non-specific low back pain encourages reassurance, self-management and physical therapy as first line care, supplemented by non-pharmacological therapies such as heat, massage, acupuncture and mindfulness where appropriate (Almeida et al. 2018). 

Medications are discouraged except where first and second-line non-pharmacological interventions are unsuccessful, and when they are prescribed, the lowest effective dose for the shortest amount of time possible is advised (Almeida et al. 2018).

For more information on how to manage back pain see MyBackPain.org.au.

What role do GPs play in managing back problems?

General practitioners (GP) are usually the first point of contact with the health care system for people with back problems. Back problems are among the most commonly managed conditions in general practice (Almeida et al. 2018). 

It is worth noting that there is currently no nationally consistent primary health care data collection to monitor provision of care by GPs. See General practice, allied health and other primary care services.

What role do hospitals play in treating back problems?

Data from the National Hospital Morbidity Database (NHMD) show that in 2021–22, there were 262,000 hospitalisations with a principal or additional diagnosis (any diagnosis) of back problems, representing 2.3% of all hospitalisations.

The rest of this section discusses hospitalisations with a principal diagnosis of back problems, unless otherwise stated. However, charts and tables also include statistics for any diagnosis of back problems.

In 2021–22:

  • there were 177,000 hospitalisations for back problems, representing 1.5% of all hospitalisations, and 690 hospitalisations per 100,000 population
  • back problems accounted for 536,000 bed days, representing 1.7% of all bed days
  • 45% of back problems hospitalisations were overnight stays, with an average length of 5.5 days (Figure 8).

Variation by age and sex

In 2021–22, for back problems hospitalisations:

  • rates were highest for people aged 80–84 years (2,500 per 100,000 population)
  • rates were higher for females compared with males (740 and 630 per 100,000 population, respectively)
  • the proportion of overnight hospitalisations was relatively high for young people (aged 10–14 and 15–19, 79% and 58%, respectively) and older people (85 and over, 61%)
  • the average length of stay of overnight hospitalisations was highest for those aged 85 and over (Figure 8).

Figure 8: Age distribution for back problem hospitalisations, by sex, 2015–16 to 2021–22

This figure shows that hospitalisation rates for back problems increased with increasing age up to the 80–84 age group, decreasing thereafter.

In 2021–22, back problem hospitalisations were composed of:

  • back or spine pain (52%), of which lower-back-pain (27% of all back problem hospitalisations), neck-pain (6.2%), and radiculopathy (6.0%) were the most common
  • vertebrae and disc disorders (43%), of which spinal stenosis (11%), lumbar and other intervertebral disc disorders with radiculopathy (8.9%), and spondylosis (8.7%) are common examples
  • deforming dorsopathies (3.9%)
  • other dorsopathies (1.7%).

Note: all percentages above represent proportion of total back problems hospitalisations.

Trends over time

From 2015–16 to 2021–22, little change was observed for hospitalisations due to back problems (between 600 and 660 per 100,000 population). The proportion and length of overnight stays also remained relatively stable (47% to 45% and 5.9 to 5.5 days, respectively (Figure 9).

Data prior to 2015–16 are not presented because rehabilitation hospitalisations were coded differently before this year.

It should be noted that the rate of hospitalisations over the past few years may have been affected by the COVID‑19 pandemic.

Figure 9: Trends over time for back problem hospitalisations, 2015–16 to 2021–22

This figure shows that between 2015–16 and 2021–22, back problems hospitalisation rates were consistently higher for females compared with males.

Comorbidities of back problems

People with back problems often have other chronic conditions, known as a ‘comorbidity’. According to the NHS, in 2022, an estimated 2.9 million (72%) people who were living with back problems also had one or more other chronic conditions (Figure 10). Among people with back problems:

  • 43% were also estimated to have mental and behavioural conditions
  • 34% were also estimated to have arthritis
  • 17% were also estimated to have asthma (Figure 10).

Figure 10: Number of selected chronic conditions and types of comorbidity in people with back problems, 2022

This figure shows that 28% of people living with back problems reported not having any of the other selected chronic conditions.

Data