Key messages

  • A large part of the ‘health gap’ – disparities in many health outcomes seen between Aboriginal and Torres Strait Islander (First Nations) people and non-Indigenous Australians – can be attributed to differences in the social determinants and health risk factors between First Nations people and non-Indigenous Australians: to close this gap, these differences need to be resolved. 
  • Analyses of survey data from 2017 to 2019 for adults aged 18-64 show that almost two-thirds (65%) of the observed gap on a composite health measure is explained by a set of 11 selected factors, broadly classified into 2 groups: social determinants of health (5 factors) and health risk factors (6). (One-third of the gap still remains unexplained, though, beyond the contributions of all factors considered in the modelling.) 
  • The differences between First Nations and non-Indigenous people on the combined set of 5 social determinants explain around 35% of the health gap. Among these, the largest effects are due to differences in employment status and hours worked (contributing to 14% of the health gap), equivalised household income (13%) and highest level of school attainment (8.9%). 
  • The differences on the combined set of 6 health risk factors explain around another 30% of the health gap. Among these, the largest effects are due to differences in current smoking status (contributing to 13% of the health gap) and overweight and obesity status (11%). 
  • If First Nations adults were to have the same average levels as non-Indigenous adults on just 3 of these critical factors (that is, the same average equivalised household income, same average employment rate and hours worked, and same average smoking rate), the health gap would be reduced by more than one-third from what is seen in the data – from a 24 to around a 14 percentage point gap.
  • The health gap seen in the 2017–19 surveys has fallen slightly (by 2.9 percentage points) from that observed in a similar earlier AIHW study (which used the same methodology to analyse data from 2011–13 surveys) – from an adjusted health gap of 26.9 percentage points in 2011–13 to 24.0 percentage points in 2017–19.

Note: The analyses used in this report are updates of previous work by the AIHW on sources of the health gap report, using the 2012–2013 Aboriginal and Torres Strait Islander Health Survey. Like for the previous analyses, we are not able to estimate the potential role of other factors contributing to the gap, such as differences in access to health services, and discrimination, for which data were not available in the surveys used. The effects of these other factors are part of the 35% of the overall health gap that remains unexplained after accounting for the role of the factors used in this analysis.

Introduction

Health at the individual level is influenced by a range of interconnected social, economic, and environmental factors. These include:

  • home, school, workplace and community environments
  • experiences of social institutions and systems
  • education
  • economic stability
  • access to health care (Braveman and Gottlieb 2014; CSDH 2008; Taylor et al. 2016).

Certain improvements made but the ‘health gap’ remains

Over the past 2 decades, some health and social indicators – such as smoking prevalence and year 12 attainment – have improved (AIHW 2023b; Productivity Commission 2023a, 2023b); however, substantial disparities remain in many health outcomes between First Nations and non-Indigenous Australians (AIHW 2023a; PM&C 2020). This is referred to as the ‘health gap’.

Much of the understanding of the health gap is based on observed differences between First Nations people and non‑Indigenous Australians in factors widely recognised as key determinants of health (Biddle 2012; Mackenbach 2015; Marmot 2011; Shepherd et al. 2012). These include differences in:

  • the social determinants of health – on average, levels of education, employment, income and housing quality are lower among First Nations people than among non‑Indigenous Australians (AHMAC 2017; AIHW 2023a)
  • health risk factors – on average, rates of smoking are higher, levels of physical activity are lower, and the risk of high blood pressure is greater among First Nations people than among non-Indigenous Australians (AHMAC 2017; AIHW 2023a)
  • access to appropriate health services – First Nations people are more likely than non‑Indigenous Australians to report difficulty in accessing affordable health services that are close by (AIHW 2015). First Nations people also face additional barriers to accessing health services due to cultural reasons, such as language problems, discrimination and cultural appropriateness (AIHW 2023a).

This article estimates the contributions made to the health gap between First Nations people and non-Indigenous Australians by exploring differences in 2 groups of health determinants: socioeconomic factors (such as education and household income) and health risk factors (such as smoking status and body mass index, or BMI). It updates a previous analysis done using 2011–13 data – reported in Chapter 6.7 in Australia’s health 2018 (AIHW 2018) – and attempts to answer 2 main questions:

  • If we adjust for demographic and geographic differences between First Nations people and non-Indigenous Australians, how large is the health gap, and how much of it can be explained by differences in social determinants and health risk factors?
  • If First Nations people and non-Indigenous Australians had similar demographic, geographic, socioeconomic and health risk factor profiles, how much of the health gap would remain?

Measuring and analysing the health gap

To measure the health gap, we construct a composite good health score using 3 components:

  • self-assessed health rating
  • number of long-term health conditions
  • a measure of emotional well-being based on the Kessler Psychological Distress scale (see Box FN.1).  

Based on this score, people in each survey were categorised as being either in good health or not, based on a cut-off value. The health gap was then defined as the difference in the proportion of First Nations people and non-Indigenous Australians considered to be in good health.

This health gap was then analysed in 2 stages:

  • First, a logistic regression model was used to estimate the association between good health and selected demographic, geographic, socioeconomic and health risk factors for each population group.
  • Second, a decomposition method related to average differences across 2 subgroups was applied to the regression model results to estimate:
    • the size of the health gap
    • how much of it could be explained by differences in individual social determinants and health risk factors between First Nations and non-Indigenous people
    • how much of the gap remained unexplained.

The analysis used data on people aged 18–64 from 2 large nationally representative sample surveys conducted by the Australian Bureau of Statistics (ABS):

  • the 2018–19 National Aboriginal and Torres Strait Islander Health Survey (NATSIHS) (ABS 2019)
  • the 2017–18 National Health Survey (NHS) (ABS 2018).

While more recent NHS data are now available, the next round of the NATSIHS is still in progress.

The final sample of individuals for these analyses consisted of around 4,230 First Nations and 9,430 non-Indigenous working-age adults (aged 18–64). This age group was chosen for 2 reasons:

  • Firstly, certain explanatory variables of interest in these surveys, such as blood pressure status and exercise participation, were available only for people aged 18 and over.
  • Secondly, people aged 65 and over were excluded because employment status is best defined for people younger than the typical retirement age. 

Note that the health gap defined and analysed in this article (see Box FN.1) differs from the gaps in life expectancy and underlying mortality between non-indigenous and First Nations people that feature in formal reporting in the National Agreement on Closing the Gap – July 2020 and other AIHW reports (AIHW 2022a, 2022b).

Size of the health gap

In 2017–2019, just under 3 in 10 (29%) First Nations people aged 18–64 were considered to be in good health compared with more than 5 in 10 (51%) non-Indigenous Australians in this age group (Figure FN.1). This implies an overall ‘health gap’ of 22.8 percentage points (pp) between the proportion of First Nations and non‑Indigenous adults assessed to be in ‘good health’, using the composite good health score (Box FN.1).

Figure FN.1: The ‘health gap’ between First Nations and non-Indigenous Australians is 23 percentage points

Proportion of people aged 18–64 considered to be in good health, by Indigenous status, 2017–19

This column chart compares the proportion of First Nations people and non-Indigenous Australians considered to be in good health: 28.6% of First Nations people were in good health, compared with 51.4% of non-Indigenous Australians in 2017–19, a difference of 22.8 percentage points.


Source: AIHW analysis of ABS NATSIHS 2018–19.

After accounting for differences in average age, sex, marital status, remoteness and state/territory of residence between First Nations and non-Indigenous survey respondents, adjusted health gap was slightly higher at 24.0 pp. This gap has fallen slightly, by 2.9 pp, from 26.9 pp, which was the adjusted health gap previously reported using the same composite good health score for 2011–13 data (AIHW 2018).

How is ‘good health’ measured?

The ‘good health’ indicator used in this analysis was based on a good health score with 3 components:

  • self-assessed health score, ranging from 1 (poor) to 5 (excellent), where a higher score indicates better health
  • emotional distress score, based on responses to the Kessler–5 psychological distress scale, ranging from 0 to 20, where a lower score indicates better health
  • morbidity score, based on the number of self-reported selected long-term health conditions, ranging from 0 to 21, where a lower score indicates better health.

Box FN.1 describes how the composite good health score was derived from these measures. This method is consistent with that used in previous AIHW analyses of the health gap, using data from 2004–08 (AIHW 2014b) and 2011–13 (AIHW 2018). For further information about the good health score, see Technical notes.

Box FN.1: Calculating the composite good health score

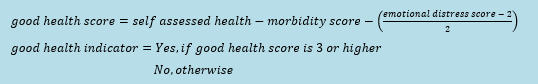
For consistency and comparability, both the measurement of the composite good health score and the cut-off value of 3.0 for the good health indicator are adopted from the previous AIHW analysis of the health gap which used the 2011–13 data (AIHW 2018).

Examples

Person A has ‘very good’ self-assessed health, hypertension and an emotional distress score of 1. Their good health score is: 

Because the score is greater than 3, Person A meets the definition of good health.

Person B has ‘good’ self-assessed health, osteoporosis, diabetes and an emotional distress score of 4. Their good health score is: 

Because the score is less than 3, Person B is not in good health.

Note: the good health score computed as above can be a negative number.

Figure FN.2: First Nations people score lower on the aggregate composite good health and the self‑assessed health component, and higher on the emotional distress and morbidity components

Average score for aggregate composite good health and its sub-components by Indigenous status, persons aged 18–64, 2017–19

This column chart shows the average score for each of the sub-components that make up the aggregate good health score. Relative to non-Indigenous Australians, First Nations people had higher scores on the emotional distress and morbidity score components and lower scores on the self‑assessed health component and the aggregate composite good health component.


Source: AIHW analysis of ABS NATSIHS 2018–19 and ABS NHS 2017–18

What were the findings?

The average of each of the sub-component scores for First Nations and non-Indigenous Australians is shown in Figure FN.2.

Consistent with the previous analysis of data from 2011–13 (AIHW 2018), First Nations people were found to have:

  • lower average values for both composite good health and self-assessed health scores
  • higher average values for the emotional distress and morbidity scores.

The largest difference in the average sub-component scores was for the emotional distress score, where the average score for First Nations people (5.3) was almost twice that for non-Indigenous Australians (2.7). The average value for the composite good health score was 0.0 for First Nations people and 2.1 for non-Indigenous Australians in 2017–19.

Sources of the health gap

The Oaxaca-Blinder decomposition technique (Blinder 1973; Oaxaca 1973) – as extended for non-linear models (Yun 2004; Powers et. al 2011) – was used to estimate how much of the health gap could be explained by differences in social determinants and health risk factors discussed below. (For further details on this decomposition methodology, see Technical notes.) Some other studies applying this method to analyse health gaps or health inequalities for other countries are Allen et al. (2022) and Lhila and Long (2012).

The aggregate decomposition results are presented in Figure FN.3. The percentage values reported in this figure for the explained component of the health gap are in reference to the adjusted health gap of 24.0 pp in 2017–19 (as reported in the previous section of this article). This adjustment already accounts for the differences between the First Nations and non-Indigenous populations on several demographic and geographic factors.

Hence, the contributions of other factors reported in this section can be treated as additional effects net of the small adjustment to the heath gap due to demographic and geographic factors alone.

Almost two-thirds of the health gap is explained by 11 factors

The results show that almost two-thirds (65%) of the health gap is explained by 11 selected factors (Figure FN.3), broadly classified into 2 groups: social determinants (5 factors) and health risk factors (6) (see Figure FN.4 for a list of the 11 factors).

Combined, social determinants explain slightly more than one-third (35%) of the health gap, and the selected health risk factors account for another 30%. An estimated 20% of the total health gap can be attributed to the overlap, or interactions, between the social determinants and health risk factors. This is because the 2 sets of factors influence each other. The overlap between these 2 sets of factors is indicated by the fact that the combined total contribution of both set of factors to the health gap in the full model results presented in Figure FN.4 is less than the sum of the contributions of the social determinants only (in a model that includes only the social determinant factors) and the contributions of the health risk factors (in a model that includes only the risk factor variables). 

One example of how an important social determinant of health varies between First Nations and non-Indigenous people is year 12 attainment, which is more than 2 times higher among non-Indigenous people aged 18-64 (65%) than among First Nations people of the same age (30%). This difference is a part of the overall 35% of the health gap explained in total by the 5 social determinant variables included in the regression model. 

Among the health risk factors, there is also a large difference in the proportion of First Nations people aged 18–64 who are current smokers (50%) compared with non‑Indigenous persons (18%); this difference is a part of the overall 30% contribution in total of the 6 health risk factors included in the model.

Figure FN.3: Over 35% of the health gap could be explained by differences in social determinants and about 30% by differences in health risk factors between the First Nations and non-Indigenous people

Proportion of the adjusted health gap explained by differences in social determinants and health risk factors between First Nations people and non-Indigenous Australians aged 18–64, 2017–19
This pie chart illustrates the health gap between First Nations people and non Indigenous Australians, which was 24 percentage points after adjusting for differences in demographic and geographic variables. It shows that 35.4% of this gap could be explained by differences in social determinants between the 2 population groups and 29.7% by differences in health risk factors. The remaining 34.8% of the gap was unexplained by the model.

Note: Gap due to other factors refers to the component of the gap unexplained by differences in the factors included in this study. This reflects the fact that the available data do not provide a complete picture of the differences between the First Nations and non-Indigenous populations. 

Source: AIHW analysis of ABS NATSIHS 2018–19 and ABS NHS 2017–18. 

Removing the differences in selected factors could reduce the gap

Our analysis indicates that the adjusted health gap would be reduced from 24.0 pp to 8.3 pp if First Nations working-age adults had the same average values for the 11 selected factors as non-Indigenous working-age adults. Most of the 15.6 pp reduction would come from social determinants (8.5 pp), and a 7.1 pp reduction from health risk factors.

In other words, 45% of First Nations working-age adults would have been assessed as being in good health if they had had the same average values as non‑Indigenous adults for the 11 selected factors (in addition to demographic and geographic factors). This figure is well above the 29% of First Nations adults in good health from the current survey results (Figure FN.1).

More than one-third of the gap remains unexplained

While differences between First Nations and non-Indigenous Australians across the 11 selected factors explain 65% of the health gap, around 35% is left unexplained by this analysis. This unexplained component reflects the fact that the available data sources provide an incomplete picture of the differences between the 2 populations. Moreover, this ‘picture’ may possibly include the effects of factors that contribute to good health that are not available in the survey data analysed. Factors contributing to this unexplained component of the health gap may include:

  • access to culturally appropriate and high-quality health-care services relative to need, which is of crucial importance for First Nations health outcomes (AHMAC 2017; AIHW 2014a, 2015)
  • connection to Country and language (Mitrou et al. 2014)
  • effects of structural disadvantage and of racism and discrimination that First Nations people face in Australian society (Durey et al. 2023; Marmot 2011).

These factors were not sufficiently captured by the available survey data used in this analysis.

Furthermore, the analysis we present can account for relationships between health status and the social and health risk factors only at one point in time (2017–19). The unexplained component may also therefore include:

  • the cumulative effects of early life events on current health
  • the effects of different social determinants and risk factors that applied at other points in time
  • the effects of other factors that are intrinsically difficult to measure in a survey that records information at one point in time.

The potential important role of cumulative effects on current health status should be further investigated with panel data or survey data linked to a time series of administrative data in order to better understand which aspects of unfavourable early life events broadly persist over the life cycle, and which have a better chance of being remedied over time.

Social determinants have the greatest effect on the health gap

Among factors considered in this study, differences in employment and hours worked contributed most to the overall health gap (14%), followed by differences in equivalised household income (13%) and highest level of school education (8.9%) (Figure FN.4).

Among the health risk factors, differences in smoking status made the greatest contribution to the health gap, at 13%, followed by overweight and obesity status (11%).

Together, employment/hours worked, household income, and smoking status account for 40% of the total health gap, which represents 62% of the total contribution made by the 11 selected factors.

If First Nations adults were to have the same average levels as non-Indigenous adults of just these 3 factors (that is, same average equivalised household income, same average employment rate and hours worked, and same average smoking rate), the health gap would be reduced by more than a third – from 24 pp to around 14 pp.

Figure FN.4: Employment and hours worked, equivalised household income, smoking status and BMI category are among the individual factors that contribute most to the health gap

This bar chart shows the contribution of individual social determinants and health risk factors to the health gap between First Nations people and non-Indigenous Australians, after adjusting for demographic and geographic factors. The individual factors that explain the largest parts of the gap were employment and hours worked (14.4%), equivalised household income (12.6%), highest level of school completed (8.9%), smoking status (13.3%) and BMI category (10.8%).

Contribution of individual social determinants and health risk factors to the adjusted health gap (as a percentage of the total adjusted health gap) between First Nations people and non‑Indigenous Australians aged 18–64, 2017–19

How do the key factors affect good health?

This section focuses on the 5 factors that contribute most to the explained health gap between First Nations and non-Indigenous adults in this analysis. Overall, the full set of the 11 socioeconomic and health risk factors explain around 65% of the gap (with 35% of the gap unexplained by the model estimated). 

These following 5 factors alone account for 92% of that 65% explained gap: 

  1. employment status and hours worked
  2. smoking status
  3. household income level (equivalised)
  4. overweight and obesity status
  5. highest level of school completed.

The results are presented of logistic regression modelling a person’s odds of being in good health, depending on the presence or absence of these 11 factors. The results obtained were the first steps from which the contributions to the gaps were estimated, with the analysis carried out separately for the sample of First Nations and non‑Indigenous adults. This section also highlights differences in results between these 2 subpopulations.

This analysis estimated an odds ratio (OR) of a person’s being in good health for each factor – that is, the odds that a person would be in good health if exposed to a specific factor (for example, if they were a current smoker) compared with the odds of being in good health if they were not exposed to that factor (not smoking). 

How to interpret the value of the estimated odds ratio for each factor

An OR value of:

  • 1 (or close to 1) means the factor has little or no effect on the odds of a person’s being in good health, compared with a person in the reference group
  • greater than 1 means the factor increases the odds of a person’s being in good health, compared with a person in the reference group. This implies a positive association between that factor and the good health measure
  • less than 1 means the factor decreases the odds of a person’s being in good health, compared with a person in the reference group (a negative association between the factor and the good health measure).

Note that the odds of being in good health is not the same as the probability of being in good health, although these concepts are related – a factor that leads to increased odds also increases the probability.

For some factors described in the sections that follow, the same factor statistically significantly increases the odds of being in good health for non-Indigenous adults, but not for First Nations adults. This may be an effect of the statistical model (considering the smaller sample size of First Nations adults, and there being inherently more non‑Indigenous adults than First Nations adults in ‘good health’ in the reference categories used to calculate the ORs). However, some of these differences in the estimated results in the models by Indigenous status form part of the unexplained component of the health gap.

The results for the estimated ORs for the 5 factors mentioned earlier (that contribute most to the explained gap) are shown in Figure FN.5 and are summarised in the sections that follow.

Figure FN.5. The main factors that significantly affect the odds of being in good health for First Nations people are being a current smoker, and being obese (risk factors) and working for at least 25 hours per week (protective factor)

This plot shows the estimated odds ratios and the associated 95% confidence intervals from a logistic regression model estimating the odds of being in good health. Odds ratios (ORs) are presented for employment status/hours worked, smoking status, equivalised household income, overweight and obesity status and highest level of school completed – although the model also controls for all the social determinants and health risk factors discussed in this article, in addition to the demographic/geographic factors of age, sex, marital status, remoteness and state/territory. The main factors that significantly affected the odds of being in good health for First Nations people were being a current smoker (OR = 0.66), working 25–39 or 40+ hours per week (OR = 1.45 to 1.50) and being obese (OR = 0.42 to 0.72).

Estimated odds ratios and 95% confidence intervals for key factors related to good health, by Indigenous status, people aged 18–64, 2017–19

Employment and household income

Being employed (for at least 25 hours per week) was statistically significantly and positively associated with good health. 

  • The odds of being in good health for people who were employed were 1.5 and 1.7 times as high as the odds for people not employed (for First Nations and non-Indigenous adults, respectively). 
  • Working fewer than 25 hours per week compared with not being employed was statistically significantly and positively associated with good health only among non-Indigenous adults.

Levels of equivalised household income were not statistically significantly associated with good health for First Nations adults; however, this could be partly due to the small survey sample size of First Nations adults in the top 3 equivalised household income deciles. Among non-Indigenous adults, being in the middle 4 and top 3 equivalised household income deciles was associated with 1.3 and 1.5 times the odds of being in good health, respectively, relative to the bottom 3 deciles.

Smoking status

Being a current smoker, compared with not being a smoker, statistically significantly reduced the odds of being in good health (0.6–0.7 times the odds) for both First Nations and non-Indigenous adults. 

Highest level of school completed

Both First Nations and non-Indigenous adults who completed a higher level of secondary schooling had greater odds of being in good health. 

  • For First Nations adults, a higher level of schooling statistically significantly increased the odds of a person’s being in good health only if they completed year 12 (1.3 times the odds, compared with the reference category of having completed year 9 or below). 
  • Non-Indigenous adults had statistically significantly increased odds of being in good health if they completed any year of schooling above year 9 (1.3–1.5 times the odds). 

Overweight and obesity status

Being obese (having a BMI greater than 30) statistically significantly reduced the odds of being in good health, compared with adults in the normal weight range (BMI 18.50–24.99), among both First Nations and non-Indigenous adults. 

Being in the class III obese category (BMI >40.00), statistically significantly reduced the odds of being in good health (0.42 and 0.34 times the odds) for both First Nations and non-Indigenous adults, respectively, relative to people with normal range BMI. 

Being in the overweight but not obese range (BMI 25.00–29.99) statistically significantly reduced the odds of being in good health only for non-Indigenous adults.

What has changed since 2011–13?

Compared with the previous analysis of data from 2011–13 (AIHW 2018):

  • the overall size of the adjusted health gap has reduced by 2.9 pp, from 27 pp to 24 pp
  • the unexplained component of the adjusted health gap has reduced, by 12 pp, from 47% to 35%, largely due to a substantial increase of 11 pp in the proportion of the health gap explained by health risk factors (which rose from 19% to 30%)
  • the proportion explained by social determinants has increased, but only by 1 pp, from 34% to 35% (Table FN.1).

Among the health risk factors, BMI and smoking status had the largest change in contribution to explaining the health gap. The proportion of the health gap explained by:

  • BMI has increased by 3.6 pp, from 7.2% to 10.8%
  • smoking has increased by 3.3 pp, from 10.0% to 13.3% (Table FN.1).

The increased contributions of these 2 factors – BMI and smoking – in explaining the health gap is consistent with the increased difference in the smoking and obesity rates between First Nations and non-Indigenous adults between these 2 time periods:

  • In 2011–13, 50.5% of First Nations adults aged 18 to 64 were current smokers compared with 21.8% of non-Indigenous adults (a difference or gap on smoking rates of 28.7 pp).
  • This difference in smoking rates of 28.7 pp increased to 32.4 pp in 2017–19 (with about the same percentage – 50.4% – of First Nations adults being smokers, but a lower proportion (18%) of non-Indigenous adults being smokers, compared with 2011–13).
  • There was a similar increase in the difference (or widening of the gap) in the obesity rate between First Nations and non-Indigenous adults between 2011–13 and 2017–19. 
Table FN.1: Health gap analyses: summary comparison of changes between 2017–19 and 2011–13 analyses
 2017–192011–13

Health gap adjusted for demographic and geographic factors (percentage points)

24.0

26.9

Proportion of adjusted health gap explained by differences in social determinants (%)

35.4

34.4

Proportion of adjusted health gap explained by differences in health risk factors (%)

29.7

18.8

Proportion of adjusted health gap due to other factors (%)

34.8

46.8

Largest individual contributors to the adjusted health gap (proportion of adjusted gap explained) (%):


Employment status

14.4

12.3

Equivalised household income

12.6

13.7

Smoking status

13.3

10.0

BMI category

10.8

7.2

Highest level of schooling completed

8.9

8.7

Note: Gap due to other factors refers to the component of the gap unexplained by differences in the factors included in this study. This reflects the fact that the available data do not provide a complete picture of the differences between the 2 populations. 

Source: AIHW analysis of ABS NATSIHS 2018–19 and ABS NHS 2017–18; AIHW (2018).

What does this mean?

The results clearly show the need to examine the key factors behind the overall health gap. Our findings highlight the areas where there is substantial potential for current and emerging targeted policies to reduce health disparities between First Nations and non‑Indigenous Australians. 

The focus should be on the 5 key areas that contribute to the health gap by:

  • boosting rates of year 12 completion
  • increasing employment
  • increasing weekly hours of work
  • reducing smoking prevalence
  • reducing obesity rates. 

Furthermore, improving one factor, such as education, can indirectly improve other health outcomes through its effect on other factors such as employment and smoking status. It is also worth noting that adult (age 25–64) employment and year 12 attainment are both current Closing the Gap targets, and maternal smoking is a supporting indicator for the healthy birthweight target.

What is missing from the picture?

Access to affordable and culturally appropriate health services are likely to explain a considerable proportion of the health gap between First Nations and non-Indigenous Australians. Health service access was not included in this analysis, however, due to a lack of available data in the surveys used.

Although the analysis in this article uses data from well-designed health surveys conducted by the ABS, the variables used to create the ‘good health’ measure at the centre of this analysis are derived from self‑assessed/self-reported data. There are some known limitations of self-reported data in providing an accurate picture of objective health, and analysis of self-reported measures alone is not sufficient to inform health policy. This analysis could be extended with additional measures that reflect objective health status if they are available in suitable future data collections or using linked data. 

As well, the surveys used for this analysis are of a cross-sectional nature which capture only a snapshot of information at one particular time. They do not account for the cumulative effects on health that arise from early life events. Furthermore, this analysis looked only at the gap in health status of working age adults (aged 18–64); results may substantially differ for other age groups, particularly among children and people aged over 64.

Finally, this analysis did not consider any cultural determinants of health for First Nations Australians, or the effect on them of experiencing structural disadvantage, racism and discrimination. It is strongly recognised that cultural determinants are important for the health of First Nations people but these factors were not sufficiently captured by the available survey data to be used in this analysis. 

Also, the Oaxaca-Blinder decomposition technique used in this article requires that the same set of factors or variables be modelled for both population subgroups; hence, the effects of factors unique to the health outcomes of First Nations peoples cannot be evaluated through this technique.

Further reading

More information on the previous analysis of the sources of the health gap (which used 2011–13 data) can be found in Chapter 6.7 in Australia’s health 2018 – Size and sources of the Indigenous health gap [PDF 800kB], accessed 4 March 2024.

An even earlier AIHW health gap analysis which used different methods to analyse 2004–08 data can be found in the Feature article in Australia’s health 2014 - The size and causes of the Indigenous health gap [PDF 365kB], accessed 4 March 2024.

More information on First Nations people’s access to health services relative to need is available in the Aboriginal and Torres Strait Islander Health Performance Framework report, accessed March 4 2024.

Related topic summaries