Chapter 3 Our communications
Reaching our audiences
At the AIHW we are committed to making the information and statistics we produce widely accessible. Following a 2014–15 review in which we were told by a variety of stakeholders that they wanted more 'bite-sized' information, we adopted what we call an 'AGILE' framework to deliver layered information to a variety of audience types. Our aim was to produce more high-level overviews to complement our traditional in-depth, policy-relevant reports for health and welfare policymakers and the public.
In 2015–16, we published 62 web snapshots across more than 30 topic areas, and used Twitter to help promote our work through social media, while our detailed reports and supplementary data tables provided researchers and policymakers with the depth of information they required. In all, the AIHW released 182 products—120 printed or print-ready publications and 62 web products (see Appendix 2).
All AIHW publications are available for download free of charge on the AIHW's website in a variety of formats to suit individual users' needs. Major publications include versions in formats suitable for people with impaired vision and to meet other accessibility requirements. All publications are available in alternative formats upon request.
AIHW publications are rigorously peer reviewed and professionally edited to ensure that they are accurate and succinct. Wherever possible, we publish under Creative Commons licences so that people can use and adapt AIHW information, with acknowledgment, without seeking our formal approval.
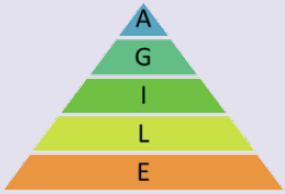
ATTRACT products are very short; they get people's attention.
GRAB products are short, easy to find and use; they are for people in a hurry.
IMPACT products have information organised in ways that are more meaningful.
LEARN products answer questions and explore ideas; they are tailored to the needs of specific audiences.
EXPLORE products allow access to more detailed data; they are for those with specific interests.
Products in the top 3 layers cover a single topic and focus on a broad audience, such as the education sector, the general public or indeed any time-poor audience. Products in the bottom 2 layers focus on more targeted audiences, such as researchers and policymakers. In considering the 'product mix,' report authors and communication teams assess audience needs early in the product development process. A product suite might consist of any combination of products in 2 or more layers depending on the topic and the target audience.
Our web products
Our web products present information in formats in which quick facts and graphics are combined to add visual interest, as well as supporting the statistical message. They provide a gateway to more information and in-depth data and analyses. Key points and simple graphics are generally just one click away from the AIHW home page, while more in-depth information can be found by 'drilling down. Where web products accompany a printed report, they link to a downloadable print-ready (PDF) version of the report. In some cases, such as our flagship reports Australia's health and Australia's welfare, and other major reports, the full reports have been converted to web pages (HTML).
During 2015–16, new web products covered topics such as:
- chronic disease and comorbidities
- cancer mortality trends and projections
- National Framework for Protecting Australia's Children
- premature mortality in Australia
- disability support services
- housing assistance
- perinatal data
- prisoner health.
We aim to make our data and information available online in several different formats, from traditional print-ready PDF and online (HTML) reports to infographics, snapshots and detailed source data tables. Formats that lend themselves to regular update as new information becomes available are being used more often.
'Snapshots, in particular, are an increasingly popular product. AIHW snapshots are created for online-only publication and are easier to find and navigate than information made available in other publication formats. They comply with Web Content Accessibility Guidelines 2.0 Level AA accessibility requirements.
An example is the Diabetes snapshot updated in 2015–16, which is available at 'Diabetes'.
Users exploring this topic would start on the Diabetes landing page where they will find quick facts such as:
- 1 in 20 Australians had diabetes in 2011–12
- 9% of all hospitalisations had diabetes as a principal or additional diagnosis
- 1 in 10 deaths recorded diabetes as an underlying or associated cause of death.
These facts link through to subpages where readers can find out more about diabetes in Australia, including incidence, treatment and deaths. The subpages provide more detailed information, which is further enhanced by figures, tables and other graphical representations of data.
Readers can also navigate to related PDF publications to learn more about specific deaths-related topics, such as injury deaths trends, use of aged care services before death and fatal burden of disease.
By drilling down still further, users can access detailed supplementary data tables. Among the reports released in 2015–16 as full-text HTML reports were:
- Residential aged care and Home Care 2013–14
- Housing assistance in Australia 2016
- Specialist homelessness services 2014–15.
The Mental health services in Australia website 'Mental health services in Australia' was updated 5 times during the year with new information on the mental health workforce and mental health-related services. There were about 107,400 visitor sessions on these web pages in 2015–16—up from the 101,800 sessions in 2014–15.
One new issues paper was added in 2015–16 to the Closing the Gap Clearinghouse website (an AIHW and Australian Institute of Family Studies collaboration). There were more than 28,400 visitor sessions on the clearinghouse site in 2015–16—down from the 34,800 sessions in 2014–15. A greater number of papers were added that year.
'In brief' and 'at a glance' publications
Our commitment to making information accessible to a wider audience includes providing 'in brief' or 'at-a-glance' summary publications to accompany key reports. We published several such reports in 2015–16, including:
- Australia's welfare2015—in brief, a 60-page summary which presents highlights from the AIHW's 12th biennial report on the nation's welfare
- Mental health services—in brief 2015, a 33-page companion publication to the AIHW's Mental health services in Australia website
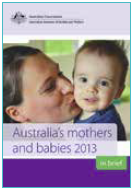
- Australia's mothers and babies 2013—in brief, a 66-page report which provides key statistics and trends on pregnancy and childbirth of mothers, and the characteristics and outcomes of their babies.
Infographics
Infographics present statistical information sourced from print and online versions of our 'in brief' reports in an easy-to-interpret graphic format. They are designed for users who need quick facts and are ideal for the education sector, the general public, media and policy makers. Examples completed in 2015–16 follow.
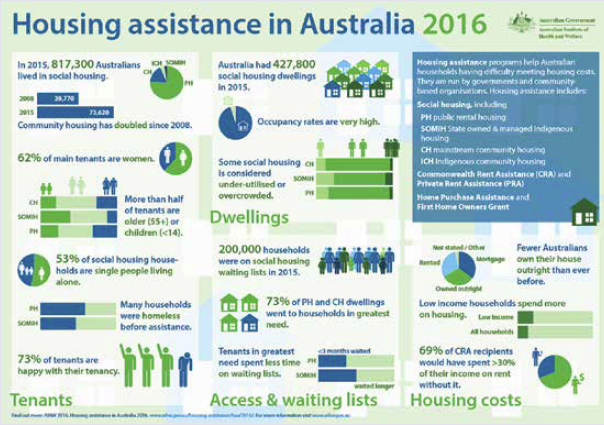
'Housing assistance in Australia 2016' accompanied the web report of the same name, which was released in lune 2016.
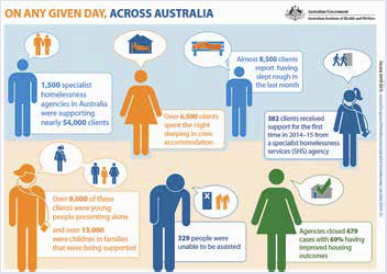
'On any given day, across Australia' accompanied the release of the Specialist homelessness services 2014–15 web report in December 2015.
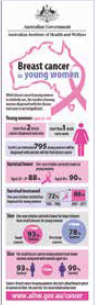
The 'Breast cancer in young women' infographic was also produced as a bookmark and distributed along with copies of an associated report at the Pink Ribbon Breakfast in October 2015.
The Breast cancer in young women report was launched by the Prime Minister of Australia, Malcolm Turnbull, in October 2015 at Cancer Australia's Pink Ribbon Breakfast in Sydney. The event's theme focused on issues faced by young women with breast cancer. The AIHW worked collaboratively with Cancer Australia in planning the launch of the report. Attendees at the breakfast included: federal and NSW ministers and departmental representatives; CEOs of key cancer organisations, such as the Cancer Australia Advisory Council and the Cancer Institute; CEOs of cancer organisations, such as the Cancer Council Australia and the National Breast Cancer Foundation; media editors and personalities; and young women who have had breast cancer.
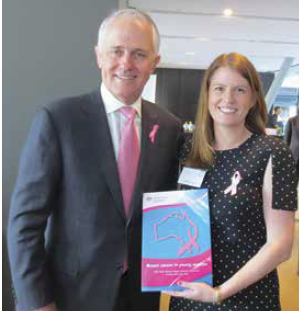
Ms Ellen Connell, who authored the Breast cancer in young women report, with Prime Minister of Australia, Malcolm Turnbull at the launch.
YouTube @aihw
In 2015–16, we extended our offering on the AIHW YouTube channel, which features videos on various health and welfare topics, including a selection of AIHW media clips, conference presentations and videos accompanying specific reports. Our YouTube channel offers our audiences another platform from which they can access AIHW information.

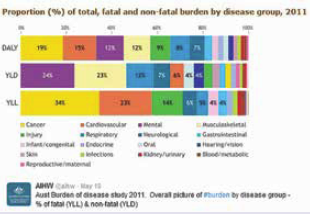
In 2015–16, the AIHW produced short videos associated with the report Australian Burden of Disease Study: impact and causes of illness and death in Australia 2011 (see below under 'Twitter').
Each video covered a particular topic: What are the key results?, What is burden of disease? and What are the key health risk factors? The videos also explained some of the key terms used in this study, including disability-adjusted life years (DALYs), years of life lost (YLLs) and years of living with disability (YLDs). These videos were downloaded more than 2,000 times, the most popular being the one that explained the term 'burden of disease.
We use our Twitter tag, @aihw, to keep followers informed about new releases on the AIHW website. There were around 9,500 @aihw followers on 30 June 2016 (compared with 7,000 in 2014–15).
In 2015–16, we tweeted 109 times (113 in 2014–15), with 333,200 (140,800 in 2014–15) 'impressions'—the number of times users viewed the tweet. During the year, we also had 884 (458 in 2014–15) link clicks and there were 601 (199 in 2014–15) re-tweets of our tweets.
The tweet with the most impressions (9,100), re-tweets (63) and link clicks (42) was associated with the release of an Australian Burden of Disease Study report on 10 May 2016. We built a Twitter campaign around the report with graphics recommending our followers to link to a series of videos.
A tweet with associated graph at 'pic.twitter.com/Qix33OSpmc' and a link to our report.

To direct @aihw followers to our YouTube channel, we added video thumbnails with links to 'www.youtube.com/watch?v=W81qL4WHDUQ'.
This video explained how we measure the burden of disease and had over 1,000 views between 10 May and 30 June 2016.
Apps
We offer 3 free AIHW apps on the Apple iOS platform—OzHealth, OzWelfare and Indigenous Health and Welfare Statistics.
These apps present facts and figures in interesting, colourful, and easy-to-use formats—making them particularly valuable for students and teachers, and giving the general public an engaging view of health and welfare statistics. The apps also include a comprehensive glossary and additional information about the AIHW. The OzHealth and OzWelfare apps each includes a quiz of 10 multiple-choice questions, with answers and scores, drawn from a bank of questions within the app.
During 2015–16, the 3 apps were downloaded 1,775 times (compared with 2,000 in 2014–15). Most users were from Australia, followed by the United States of America, Canada and United Kingdom. The OzHealth app was the most popular, with 985 downloads.
The apps will be updated with new data when new editions of the associated reports are released. The OzWelfare app was updated with data from Australia's welfare2015.
In May 2016, we began the development of an Android version of the OzHealth app, to coincide with the release of the Australia's health 2016 report in the latter part of 2016. An Android app will allow us to expand our audience to those who use the Google Play store and potentially Windows 10 devices.
Notification services for clients and stakeholders
We also use self-subscription email notification services to advise stakeholders of the release of AIHW publications and resources. Subscriptions to these notices rose by 9% in 2015–16 compared with the previous year (Table 3.1).
Table 3.1: Email notification service subscriptions, 2012 to 2016
| Year at 30 June | 2012 | 2013 | 2014 | 2015 | Change 2015 to 2016 |
2016 |
|---|---|---|---|---|---|---|
| For releases of our: | ||||||
|
5,382 | 6,090 | 5,729 | 5,984 | Increase | 6,308 |
|
4,102 | 4,583 | 4,426 | 4,670 | Increase | 4,947 |
|
2,157 | 2,961 | 3,581 | 4,144 | Increase | 4,573 |
|
2,398 | 3,620 | 4,632 | 5,609 | Increase | 6,499 |
| Total | 14,039 | 17,254 | 18,368 | 20,407 | Increase | 22,327 |
Customer care charter
The AIHW customer care charter is available online at 'Customer care charter'. The charter describes how we make information and data available and accessible, including our timeliness and other standards. It also reinforces our commitment to privacy in dealing with personal information and provides information on how clients can provide feedback, make complaints and obtain further information about AIHW products.
AIHW staff responded to almost 2,000 requests for general information in 2015–16—an average of about 8 requests a day.
AIHW website
The AIHW website is the main conduit for all AIHW information, principally our PDF and HTML (web) reports and a range of other data-related outputs. All these products are free to view or download.
The AIHW uses 'sessions' as a measure of our web traffic—obtained through Google Analytics. A session is a discrete period of time in which a single visitor is actively engaged with the website. Before April 2014, Google Analytics called this a 'visit.
There were over 2.9 million sessions on our website in 2015–16—an increase of 8.4% over 2014–15 (2.7 million; Figure 3.1).
Figure 3.1: Sessions on the AIHW website, 2006–07 to 2015–16
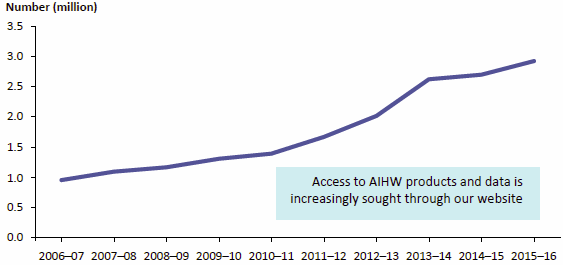
Note: Data for this figure are available in Table A8.23.
Downloads of popular reports
The publications most frequently downloaded from the AIHW website in 2015–16 are detailed in Table 3.2. Australia's health 2014 was the most downloaded report during the year, with 25,864 downloads. Australia's health has been consistently our most downloaded publication for nearly 20 years.
Other publications routinely appearing in our top 10 downloaded publications in recent years have been Young Australians: their health and wellbeing 2011, National Drug Strategy Household Survey detailed report2013 and A picture of Australia's children.
Table 3.2: Top 10 publications downloaded from the AIHW website, 2015–16
| Rank | Title | Release date | Downloads |
|---|---|---|---|
| 1 | Australia's health 2014 | 25 June 2014 | 25,864 |
| 2 | Young Australians: their health and wellbeing 2011 | 10 June 2011 | 7,234 |
| 3 | National Drug Strategy Household Survey detailed report 2013 | 25 November 2014 | 6,781 |
| 4 | Australia's health 2012 | 21 June 2012 | 6,061 |
| 5 | A picture of Australia's children 2012 | 31 October 2012 | 5,858 |
| 6 | Australia's hospitals 2013–14: at a glance | 23 June 2015 | 4,845 |
| 7 | Australia's welfare 2015 | 20 August 2015 | 4,829 |
| 8 | Australia's health 2014: in brief | 25 June 2014 | 4,568 |
| 9 | Health expenditure Australia 2013–14 | 24 September 2015 | 4,371 |
| 10 | The health and welfare of Australia's Aboriginal and Torres Strait Islander peoples 2015 | 9 June 2015 | 4,344 |
Note: These rankings are based on downloads of each report during 2015–16 either for the full year or from the stated release date in 2015–16 to 30 June 2016.
Media
Media coverage
The AIHW issued 57 media releases in 2015–16, 25 fewer than in 2014–15 (Table 3.3; see Figure 2 for a longer time series) and overall media coverage fell by 14.5%.
Media coverage fell across all formats, with the exception of print items, which saw a significant increase. For the first time, online news items overtook radio as the leading form of media coverage.
The decline in the number of media releases issued was in line with the AIHW's recent focus on engaging with media and the wider community in new and innovative ways, such as through social media, videos and graphical representations of statistics.
Table 3.3: Media coverage (items) and media releases, 2011–12 to 2015–16
|
Media type |
2011–12 | 2012–13 | 2013–14 | 2014–15 | Change 2014–15 to 2015–16 |
2015–16 |
|---|---|---|---|---|---|---|
| 564 | 458 | 507 | 426 | Increase | 798 | |
| Radio | 1,956 | 1,929 | 1,620 | 1,826 | Decrease | 1,106 |
| Television | 138 | 128 | 122 | 230 | Decrease | 129 |
| Online | 1,778 | 1,894 | 1,311 | 1,650 | Decrease | 1,496 |
| Australian Associated Press | 96 | 92 | 15 | 41 | Decrease | 37 |
| Total | 4,532 | 4,501 | 3,575 | 4,173 | Decrease | 3,566 |
| Media releases | 82 | 84 | 80 | 82 | Decrease | 57 |
Media coverage of individual reports
AIHW reports that attracted the most media coverage during the year are listed in Table 3.4. Topping the list was the web report Chronic disease comorbidity, with 164 news items.
This was followed by Breast cancer in young women: key facts about breast cancer in women in their 20s and 30s, which received 137 media mentions.
Table 3.4: Top 10 reports for media coverage, 2015–16
| Rank | Title | Media mentions |
|---|---|---|
| 1 | Chronic disease comorbidity (web report) | 164 |
| 2 | Breast cancer in young women: key facts about breast cancer in women in their 20s and 30s | 137 |
| 3 | Trends in methylamphetamine availability, use and treatment: 2003–04 to 2013–14 | 130 |
| 3 | BreastScreen Australia monitoring report 2012-2013 | 130 |
| 5 | Australian Burden of Disease Study: impact and causes of illness and death in Australia 2011 | 109 |
| 6 | Australia's welfare 2015 | 96 |
| 7 | Domestic and family violence and homelessness 2011–12 to 2013–14 (web report) | 69 |
| 8 | Monitoring the health impacts of mandatory folic acid and iodine fortification 2016 | 66 |
| 9 | Young people returning to sentenced youth justice supervision 2015 | 64 |
| 10 | Alcohol and other drug treatment services in Australia 2014–15 | 61 |
Parliamentary relations
Budget estimates hearings
The acting AIHW Director appeared at the Additional Estimates hearing for the Health portfolio before the Senate Community Affairs Legislation Committee on 10 February 2016. During 2015–16, the AIHW provided responses to 5 questions on notice and input for 21 portfolio-wide responses to questions on notice, arising from this hearing and other annual Senate Estimates hearings on 21 October 2015 and 6 May 2016.
Inquiries
The AIHW provided 7 submissions to parliamentary and government committee inquiries in 2015–16 (Table 3.5). Staff appeared before 1 committee during the year.
Table 3.5: Submissions to parliamentary and government inquiries, 2015–16
| Committee | Inquiry name |
|---|---|
| Federal | ? |
| House of Representatives Standing Committee on Economics | Home ownership |
| House of Representatives Standing Committee on Health | Chronic disease prevention and management in primary health care |
| Joint Committee on Law Enforcement | Illicit tobacco |
| Senate Select Committee on Health | Improving access to and linkage between health data sets held by Commonwealth entities |
| Senate Standing Committees on Community Affairs—References Committee | Future of Australia's aged care sector workforce |
| Productivity Commission | National education evidence base inquiry |
| State/territory | ? |
| Victorian Parliament Joint Family and Community Development | Services for people with autism spectrum disorder |