Soccer

An estimated 1.3 million Australians aged 15 and over played soccer in 2021–22 (ASC, 2022). There were 3,700 injury hospitalisations attributed to soccer – 3,100 males and 600 females. For those aged 15 and over, the rate of hospitalisation was about 230 per 100,000 participants.
Following an increase in 2020–21, soccer injury hospitalisations in 2021–22 were almost as low as hospitalisations in 2019–20 (Figure 1).
Figure 1: Trend in soccer injury hospitalisations, by sex, 2012–13 to 2021–22
For more detail, see data tables B1–2.
The highest number of hospitalisations in 2021–22 was in the 15–19 age group (Figure 2).
Figure 2: Age distribution of soccer injury hospitalisations, 2021–22
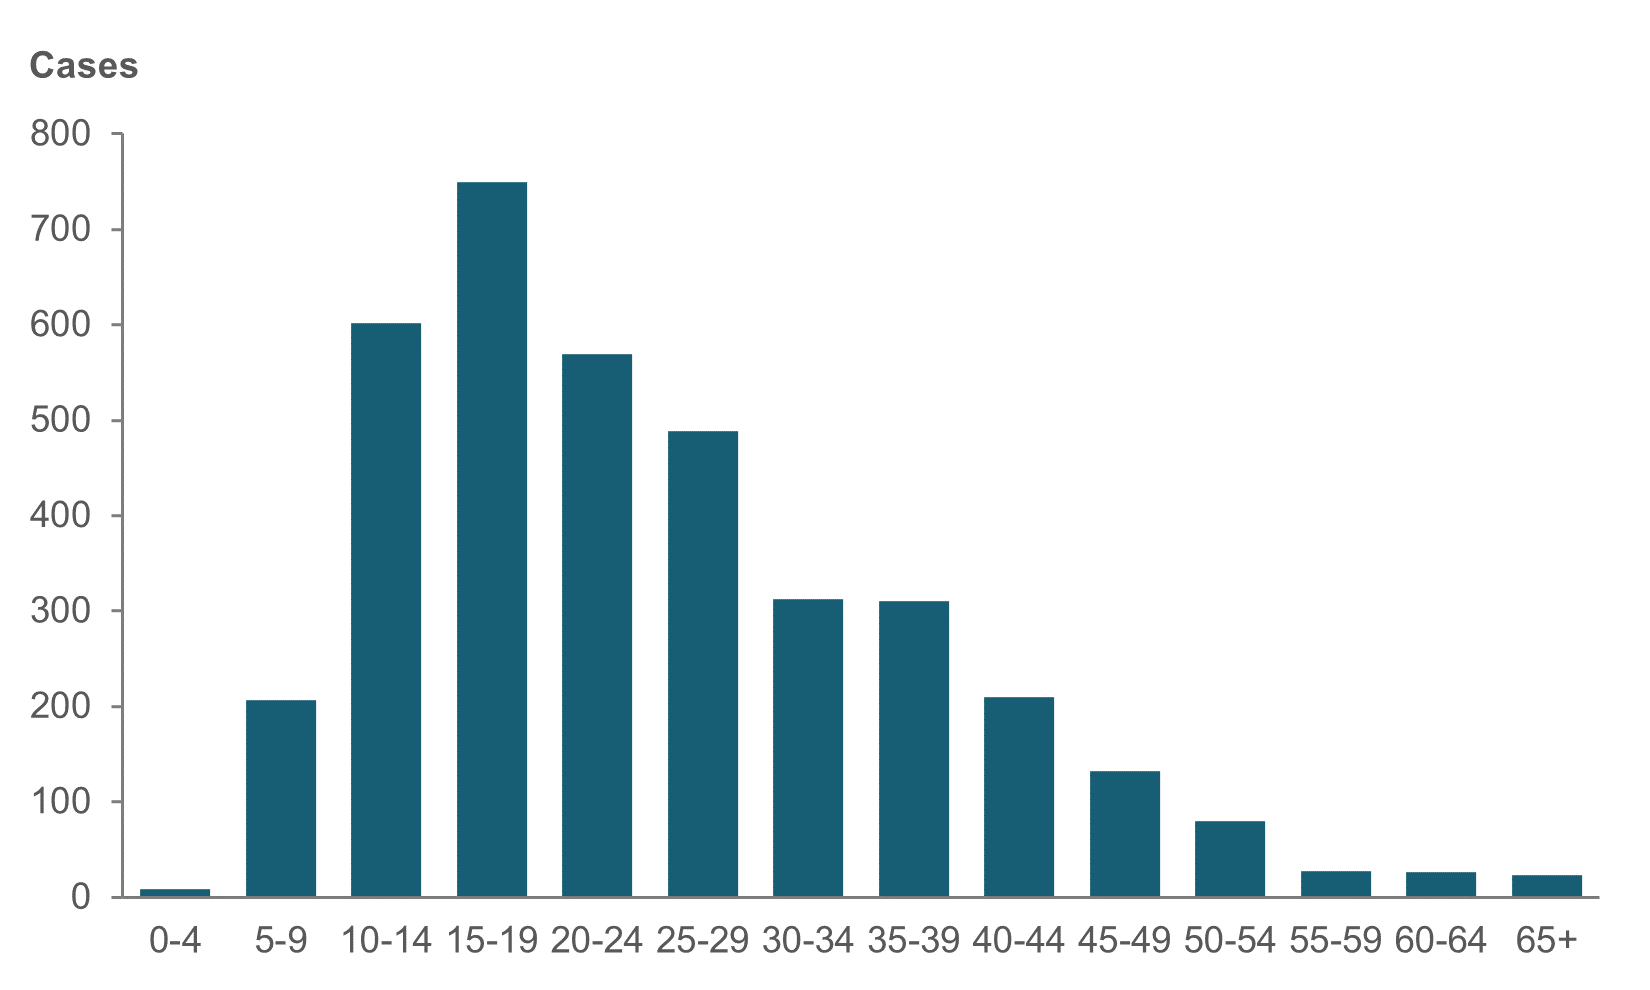
Source: AIHW NHMD.
For more detail, see data table A14.
Over half of hospitalisations were fractures (51%), and over a quarter were soft-tissue injuries (31%) (Figure 3).
Figure 3: Top 5 injury hospitalisations from soccer, by type of injury as a proportion, 2021–22
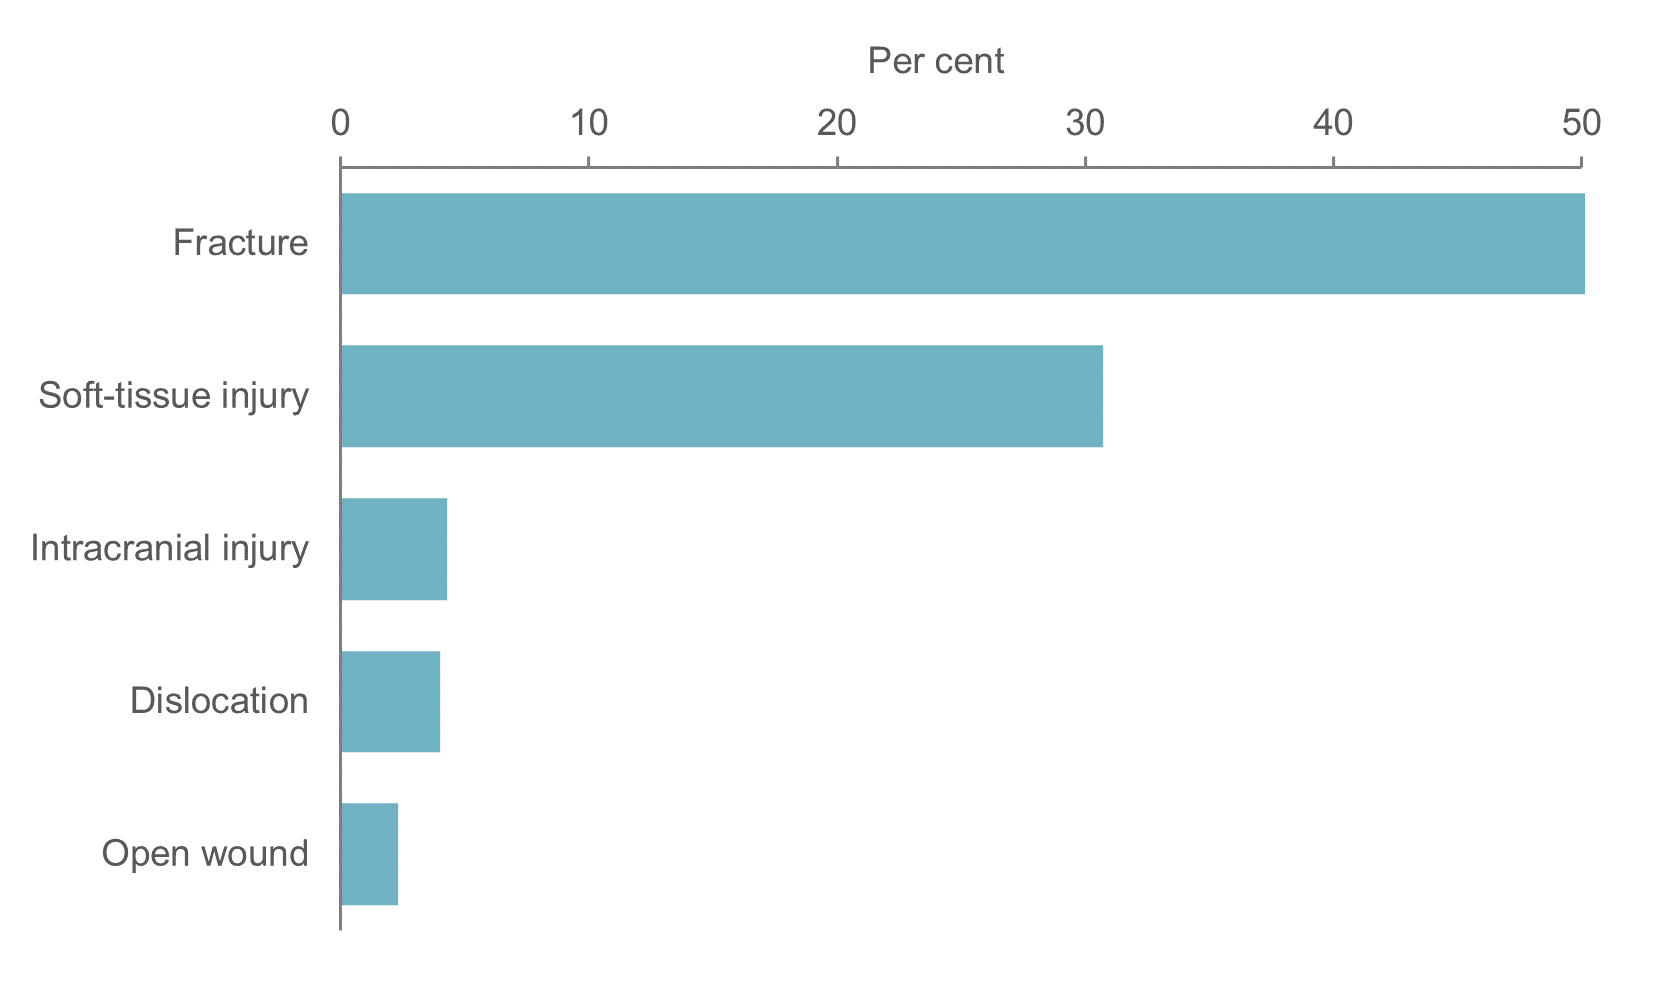
Note: Type of injury is derived from the principal diagnosis.
Source: AIHW NHMD.
For more detail, see data table A25.
There were 155 hospitalisations for concussion (6.6%).
The main injury was most often to the leg or hip (46%), followed by the arm or shoulder (22%) (Figure 4).
Figure 4: Soccer injury hospitalisations, by body part injured, as a proportion, 2021–22
Diagram of human body shows percentage of body parts injured in hospitalisations in 2021–22. Trunk, ankle and feet contributed the least (4%).

Notes
1. Body part injured is derived from the principal diagnosis.
2. ‘Trunk’ includes thorax, abdomen, lower back, lumbar spine & pelvis.
Source: AIHW NHMD.
For more detail, see data table A26.
Where it was specified, the most common cause of injury was contact with another person, and the next most common was falls involving an object (Figure 5).
Figure 5: Cause of injury as a proportion when specified, soccer injury hospitalisations, 2021–22
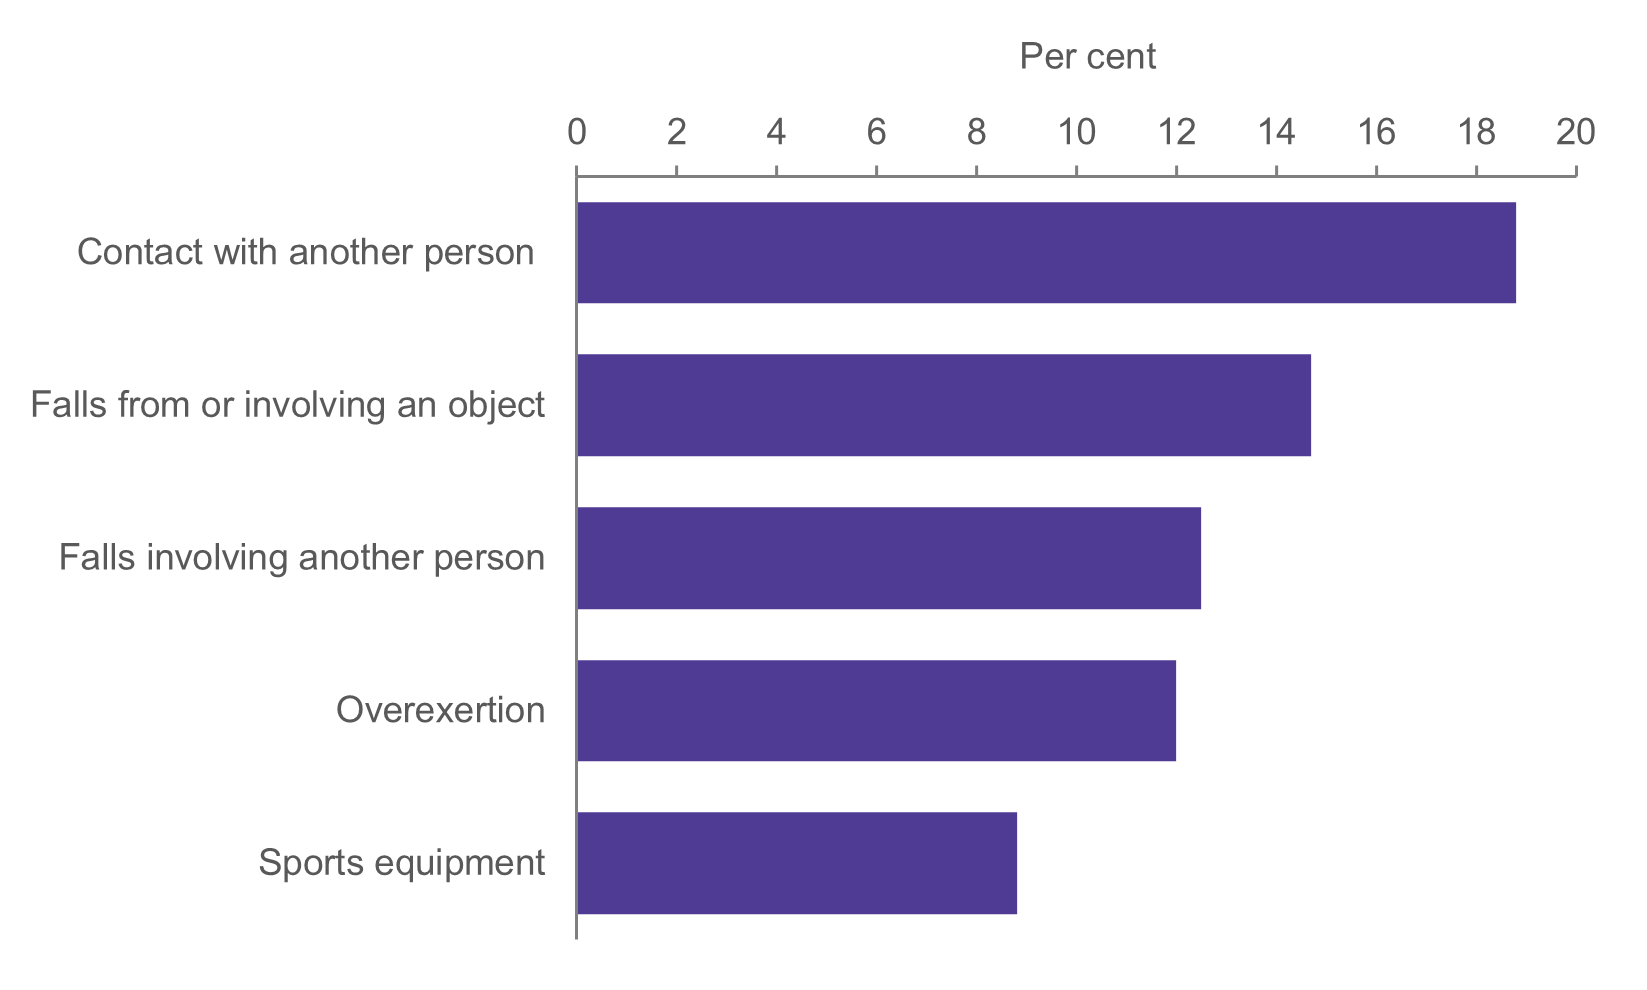
Source: AIHW NHMD.
For more detail, see data table A27.