Netball

An estimated 659,000 Australians aged 15 and over played netball in 2021–22 (ASC, 2022). There were 1,300 injury hospitalisations attributed to netball – 1,100 females and 130 males. For those aged 15 and over, the rate of hospitalisations was about 160 per 100,000 participants.
Netball injury hospitalisations for males in 2021–22 continue to plateau, while for females they are almost as low as hospitalisations in 2019–20 (Figure 1).
Figure 1: Trend in netball injury hospitalisations, by sex, 2012–13 to 2021–22
For more detail, see data tables B1–2.
The highest number of hospitalisations in 2021–22 was in the 20–24 age group (Figure 2).
Figure 2: Age distribution of netball injury hospitalisations, 2021–22
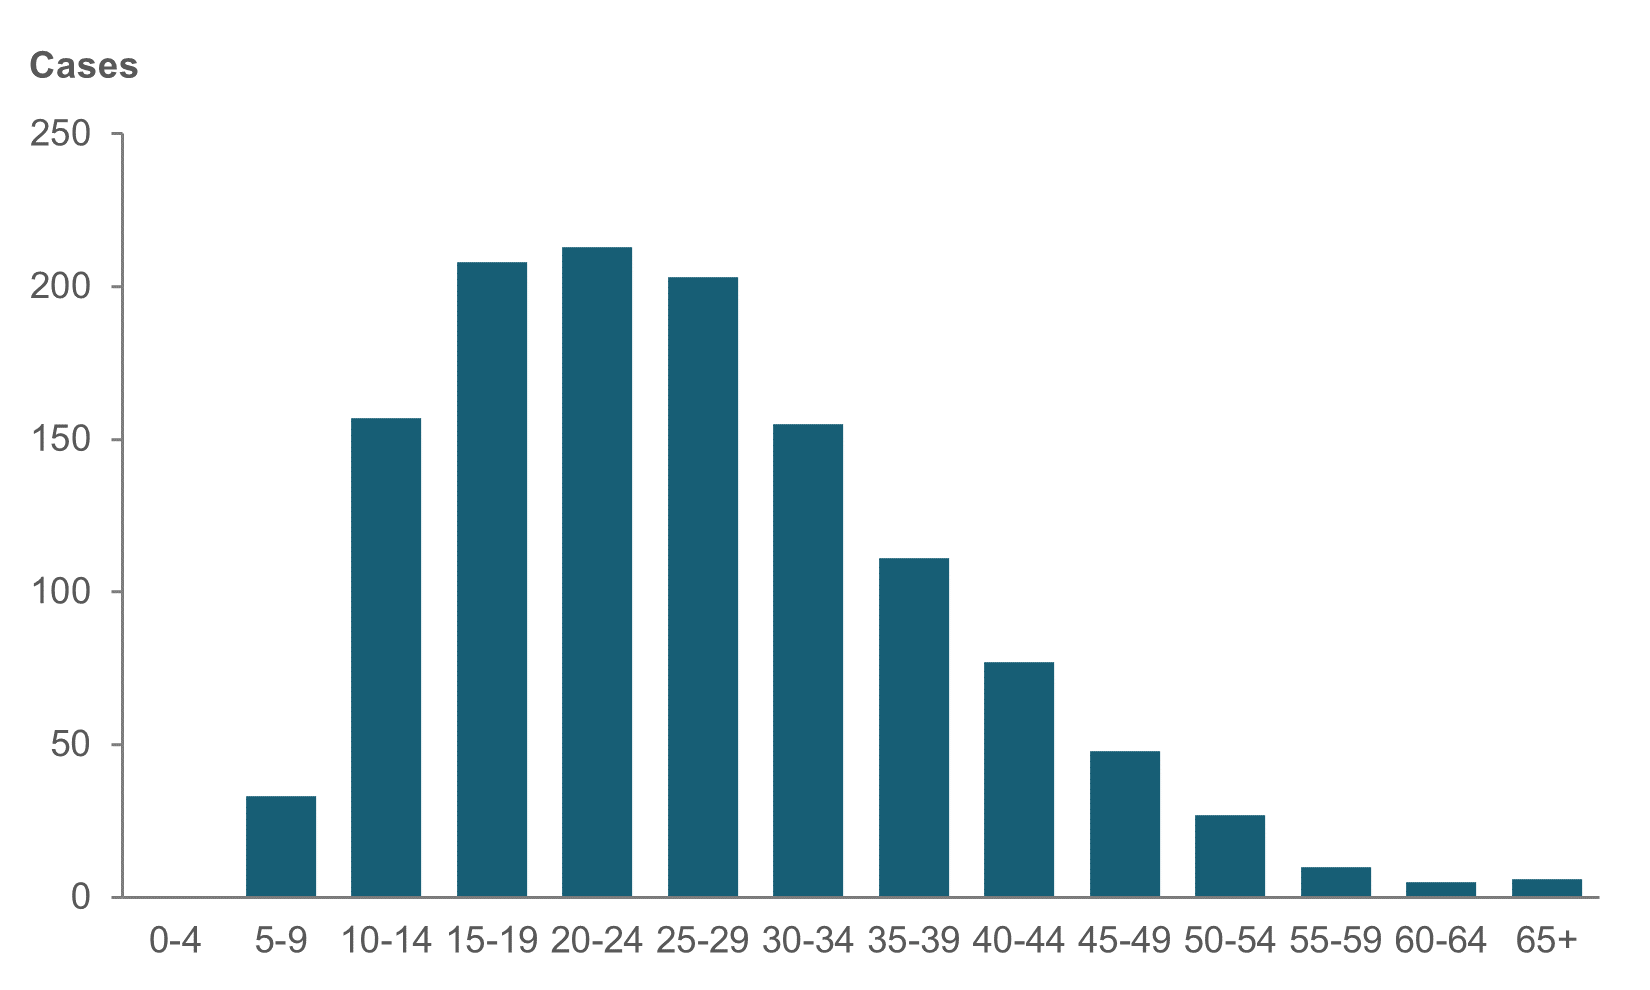
Source: AIHW NHMD.
For more detail, see data table A14.
Just over half of these hospitalisations were for soft-tissue injuries (52%), while just over a third were for fractures (34%) (Figure 3).
Figure 3: Top 5 injury hospitalisations from netball, by type of injury as a proportion, 2021–22
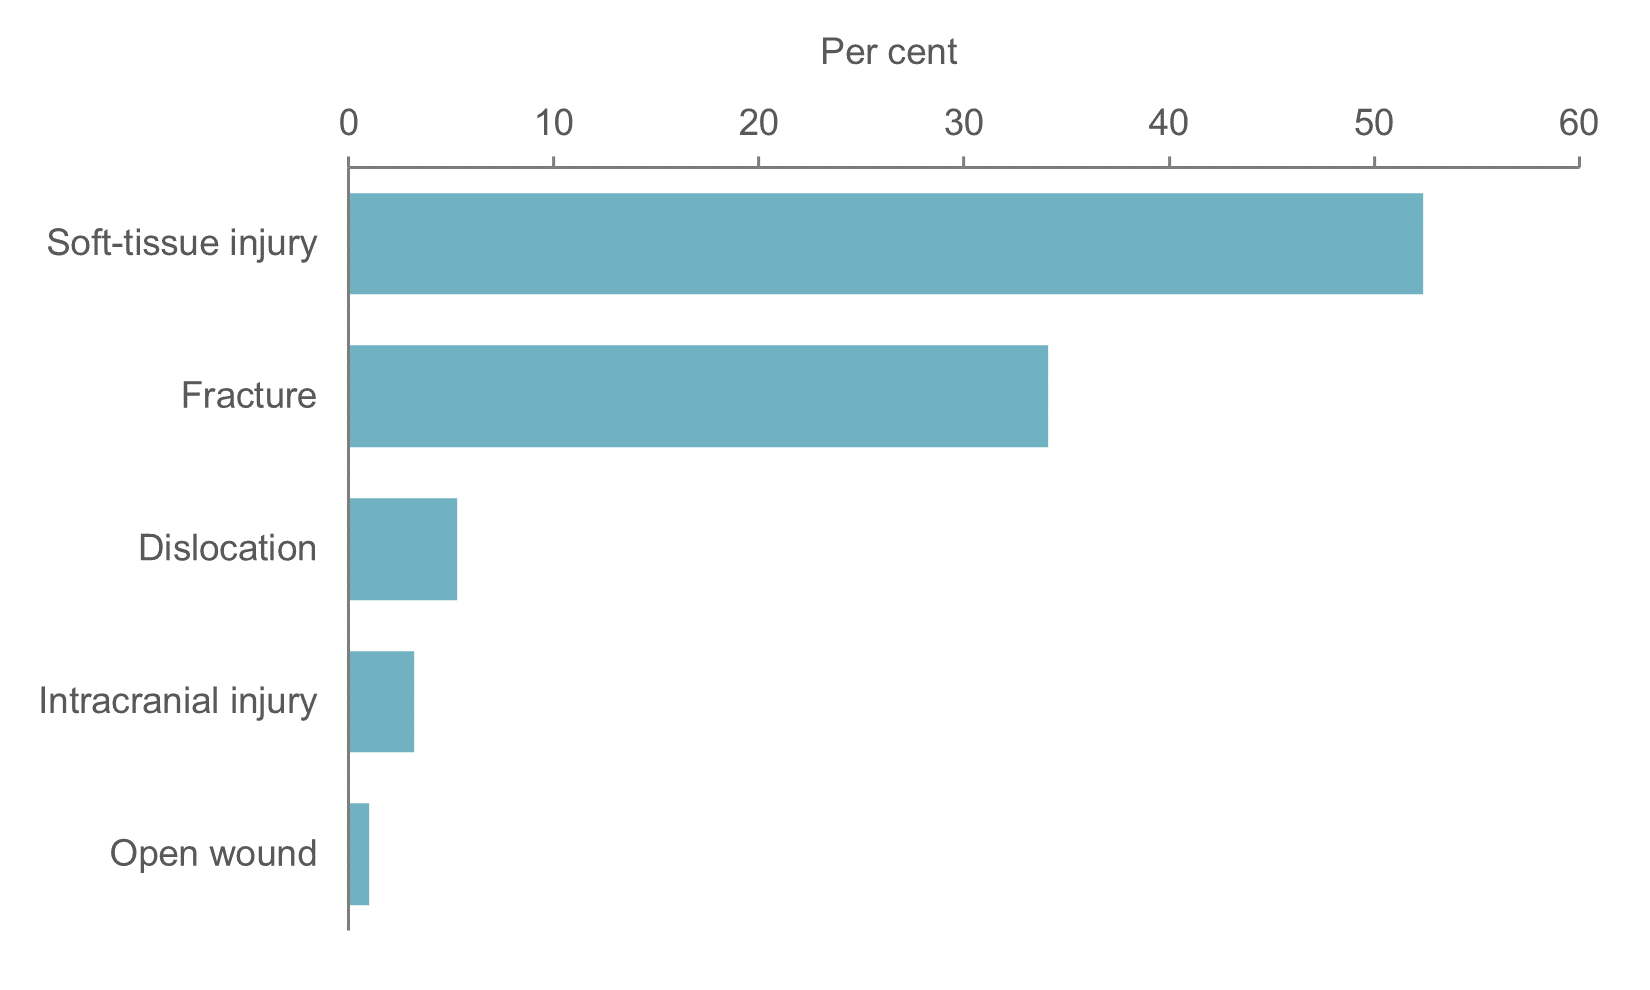
Note: Type of injury is derived from the principal diagnosis.
Source: AIHW NHMD.
For more detail, see data table A25.
There were 38 hospitalisations for concussion.
The main injury was to the leg or hip in 56% of cases (Figure 4).
Figure 4: Netball injury hospitalisations, by body part injured, as a proportion, 2021–22
Diagram of human body shows percentage of body parts injured in hospitalisations in 2021–22. The trunk contributed the least at 1% of cases.

'Notes
1. Body part injured is derived from the principal diagnosis.
2. ‘Trunk’ includes thorax, abdomen, lower back, lumbar spine & pelvis.
Source: AIHW NHMD.
For more detail, see data table A26.
Where it was specified, the most common cause of injury was overexertion (20%), followed by falls involving an object (19%) (Figure 5).
Figure 5: Cause of injury as a proportion when specified, netball injury hospitalisations, 2021–22
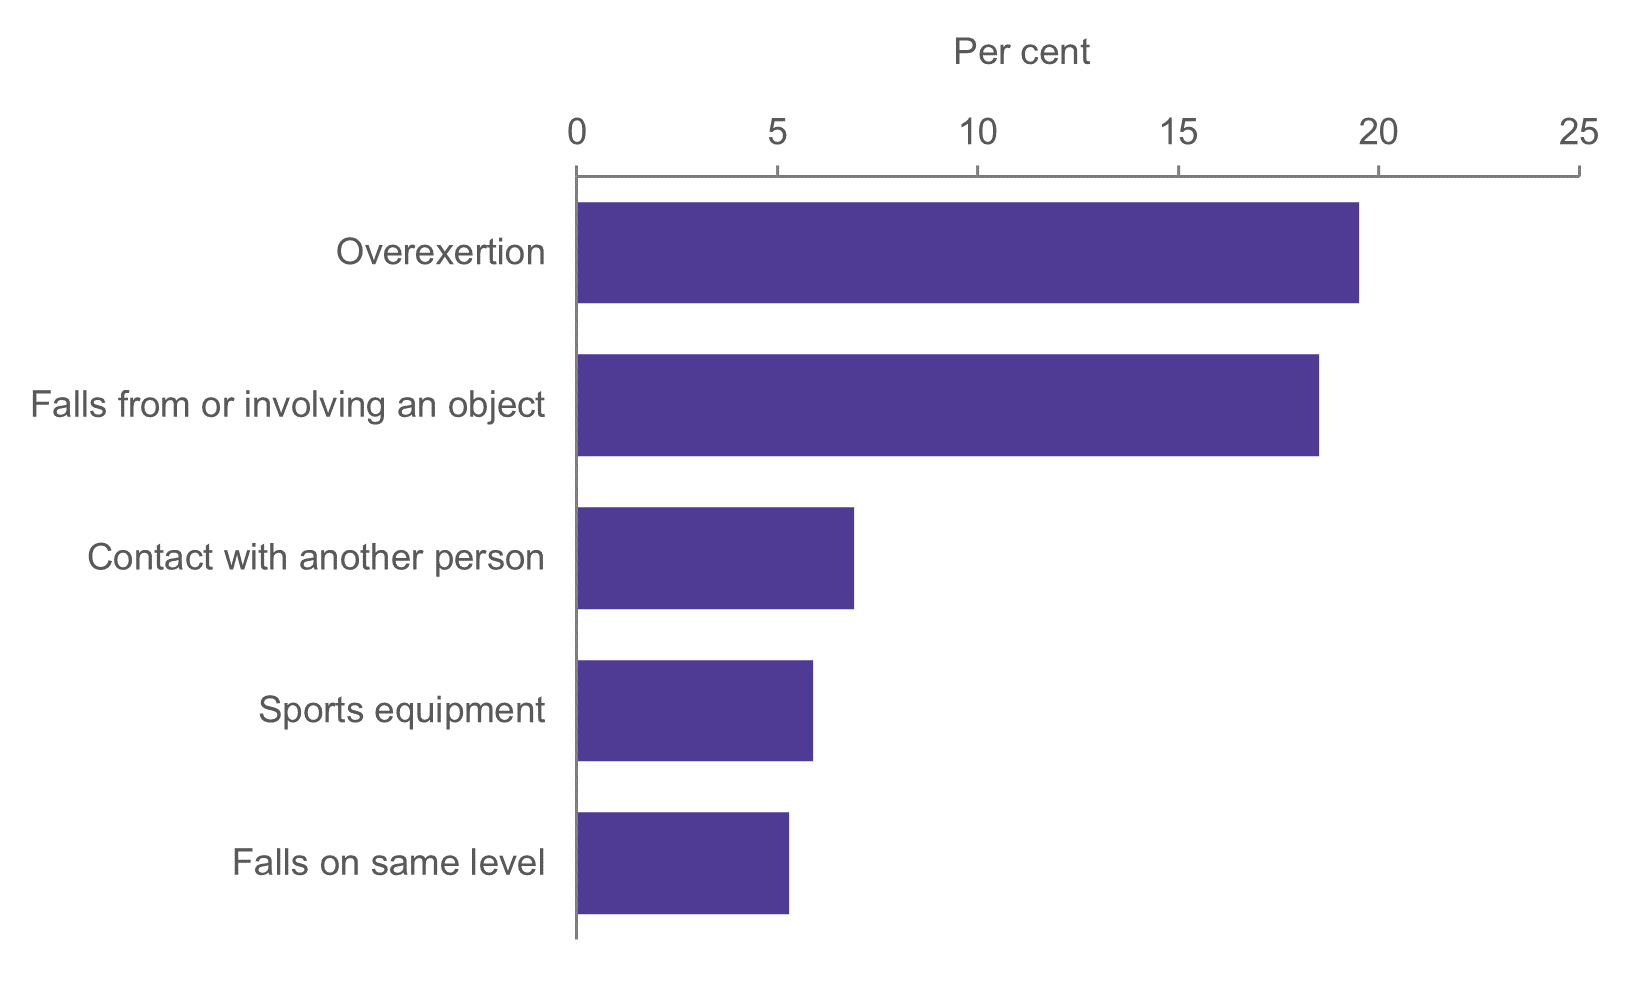
Source: AIHW NHMD.
For more detail, see data table A27.