Summary
Environmental determinants of health are the elements of the natural and built environments that affect human health. Clean air outdoors and in the home, access to water that is safe for drinking and recreation, and access to public parks to play and exercise in are some of the ways the environment helps to keep us healthy. However, increasing pressure from factors such as climate change and human activities are negatively affecting the environment, which is in turn threatening the health of the population, for example through exposure to extreme weather events or air, soil or water pollution (Creswell et al. 2021).
Understanding how, and the extent to which, the environment affects health, and the change over time is essential for the development of, and informing on, policies and strategies to protect human health from environmental hazards. We need to be able to measure and monitor environmental determinants of health, and to do so we need a framework that sets out the relevant issues in Australia, and suitable indicators for tracking progress on these.
Australian government public health policy is increasingly including a stronger focus on the environmental determinants of health. The National Preventive Health Strategy 2021–2030 recognises the need for indicators of environmental determinants of health to contribute to the comprehensive monitoring and surveillance system for preventive health (Department of Health and Aged Care 2021). The National Health and Climate Strategy also acknowledges the need for relevant environmental health indicators to prepare for and respond to the impacts of climate change on health (Department of Health and Aged Care 2023b).
This report outlines a framework of indicators for measuring and monitoring environmental determinants of health in Australia. The scope of the framework includes indicators of the natural and built environment and the impact of these on the Australian population’s health. Although a related concept, occupational indicators are out of scope for this report.
The framework was developed using a 3-stage process (adapted from Mason et al. 2018), involving scoping, selection and design:
Scoping
Background research was conducted to:
- evaluate international examples of environmental health indicator sets and tracking programs, and identification of issues relevant to the Australian context.
- identify environmental health conceptual frameworks that exist within the literature. Conceptual frameworks provide a structured approach to define the key themes or concepts for which to identify indicators.
In addition, the Australian environment and health data landscapes were surveyed to identify available data sources for populating the indicators, and to identify data gaps.
Selection
The conceptual framework selected was the Driving force, Pressure, State, Exposure, Effect and Action (DPSEEA) framework (Corvalán et al. 1996). This was used to guide the organisation of information on the relationship between drivers of environmental hazards, and the health outcomes of these, ensuring the causal relationships between them are clearly defined, and supported by evidence.
This led to the identification of 8 overarching domains and 20 sub domains relevant to environmental health in Australia:
- Air quality (indoor and outdoor)
- Housing
- Water quality
- Built environment
- UV and sun radiation
- Food environment
- Climate and extreme weather
- Waste (Figure 1.1)
Figure 1.1: Framework for monitoring climate change and environmental health in Australia, including domains and sub domains, and an illustration of interrelationships
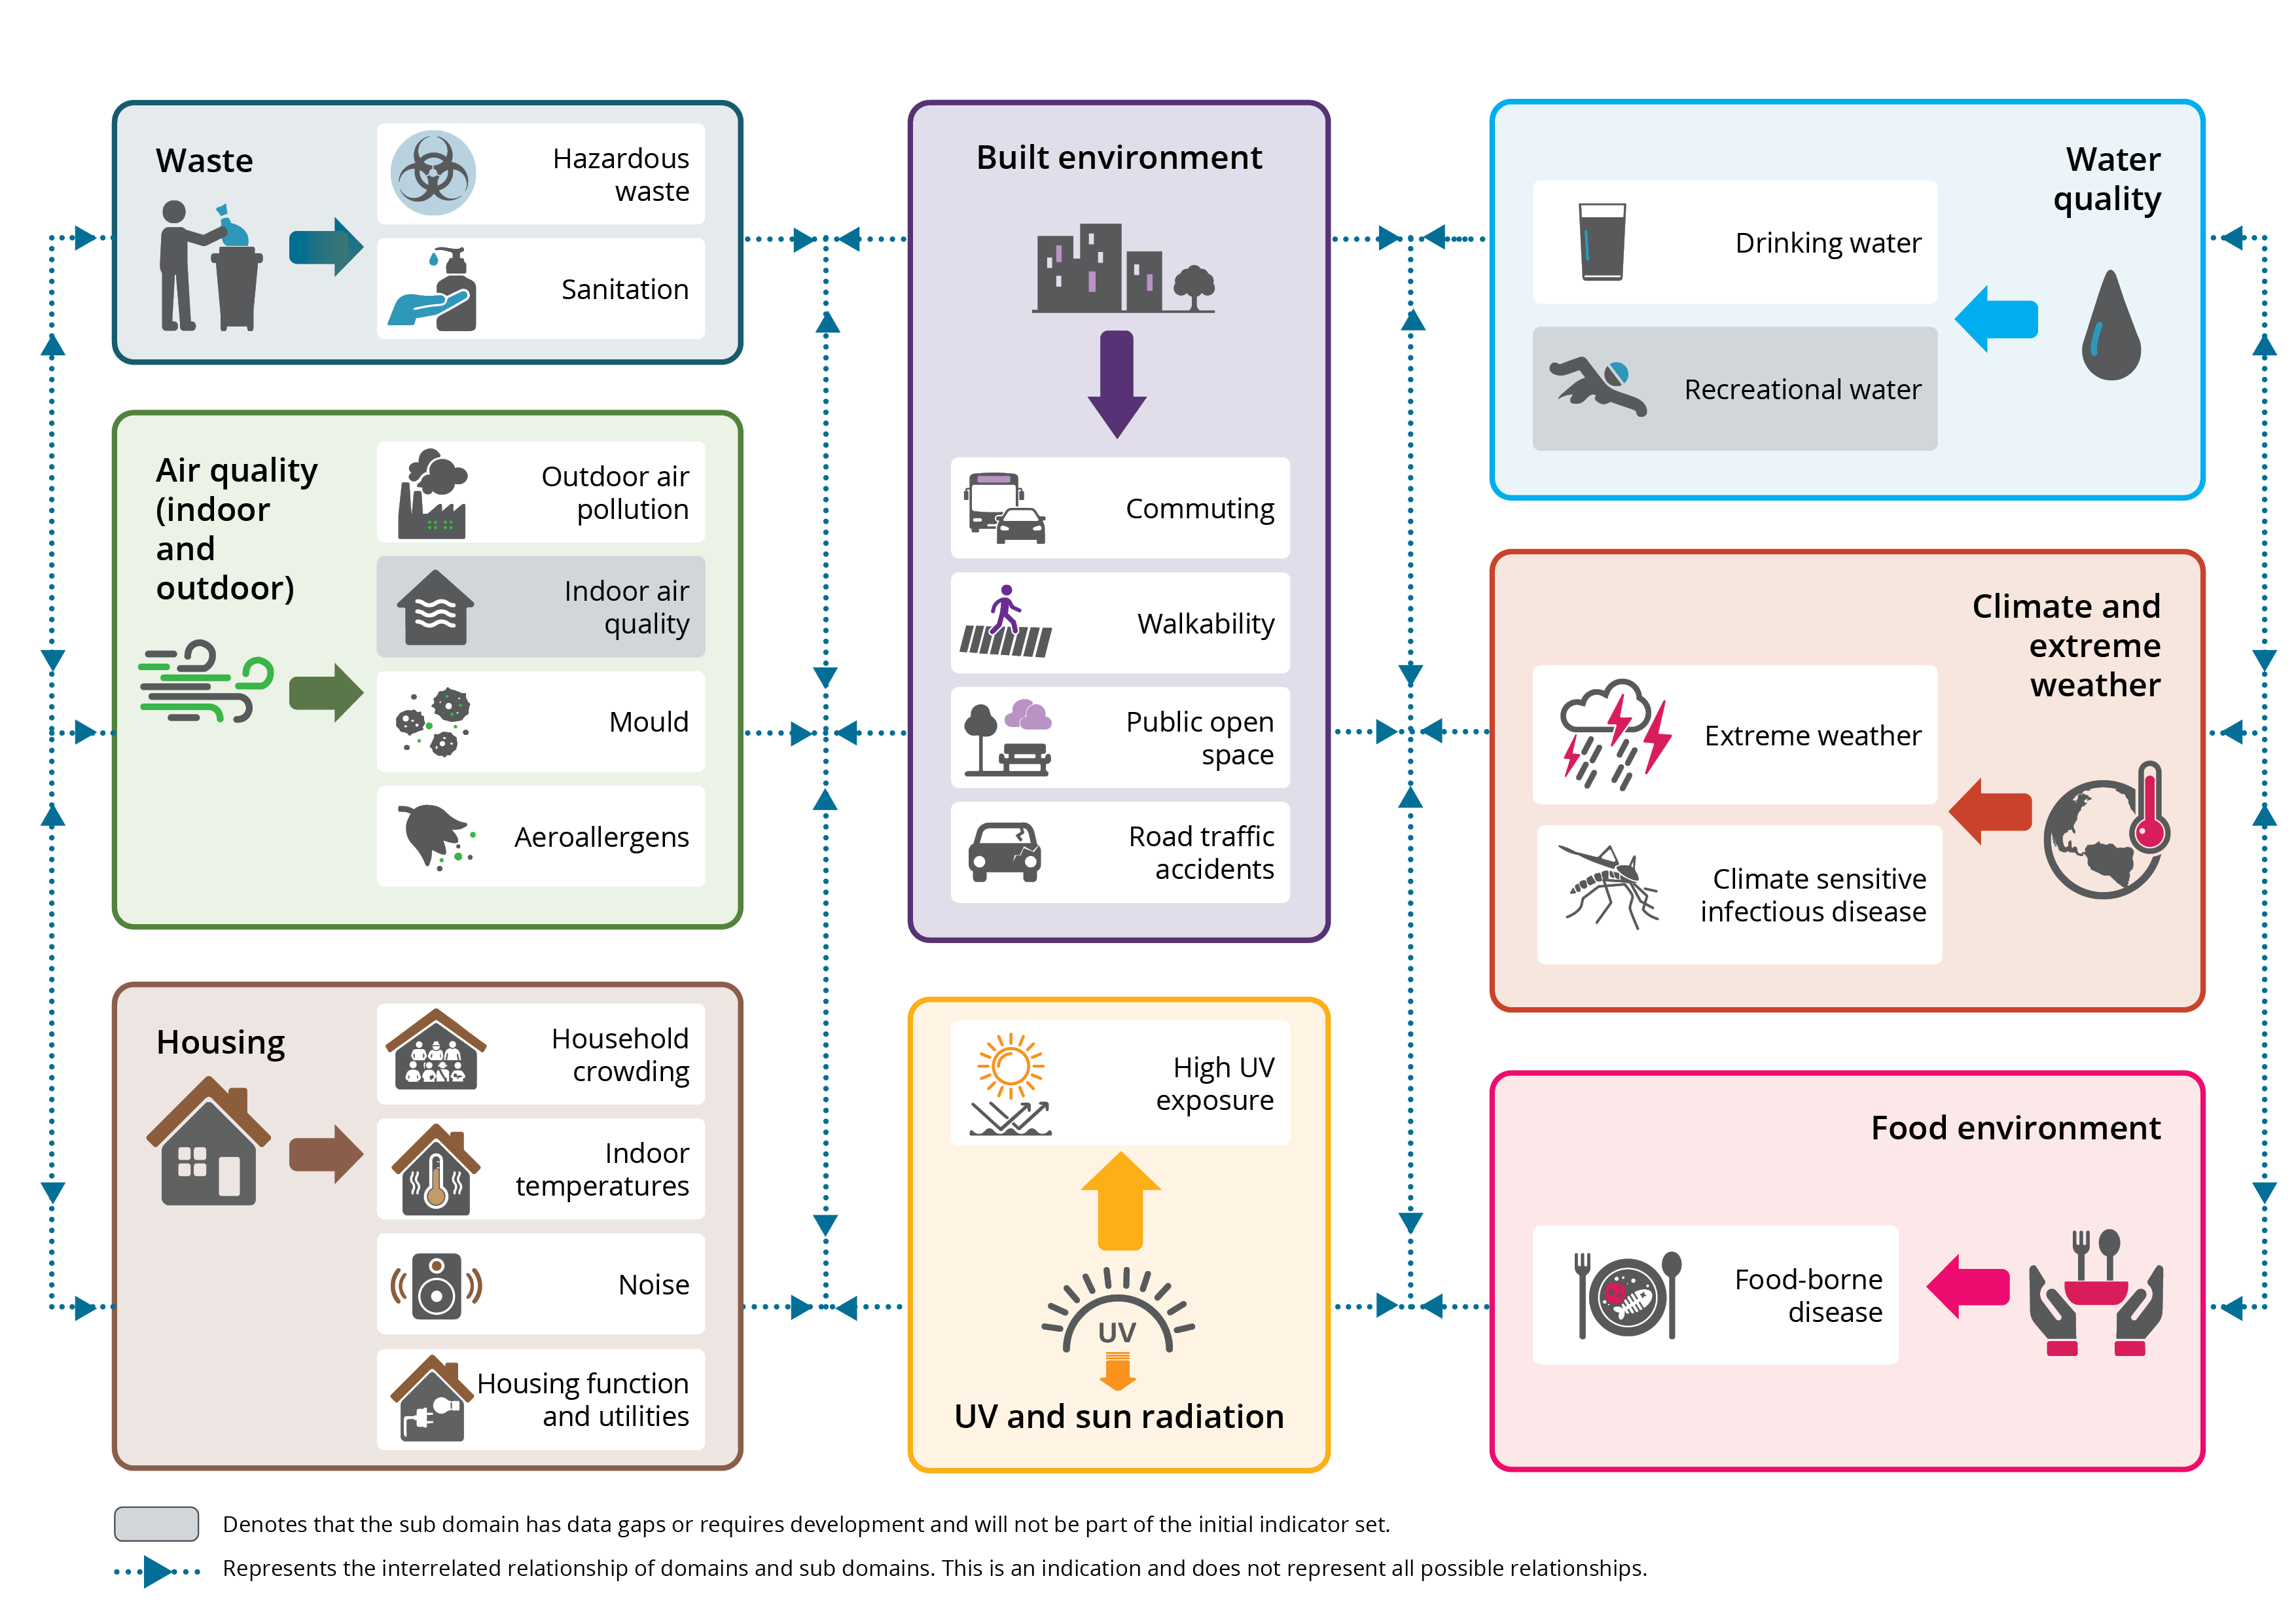
Source: Australian Institute of Health and Welfare
Note: Figure 1.1 is also available in a PDF document on the Related material page.
Indicators for measuring and monitoring specific issues relevant to each domain were identified, and those that met defined selection criteria were included. The indicators chosen included the following elements of the DPSEEA framework:
- Indicators of effect describe the human health impact of a hazard, as measured using either burden of disease methodology, and/or administrative health data sources where medical conditions, injuries or deaths with explicitly related diagnoses are identified.
- Indicators at the exposure level in the framework provide context on the amount of exposure to a natural or built environmental hazard within the population.
- Indicators of the state describe how much of the hazard exists in the environment.
The final indicator framework:
- Consists of 30 indicators for which data are currently available to enable reporting on climate change and environmental health in Australia. These are termed the ‘reportable’ indicators (see Figure 1.2).
- Highlights those issues and data gaps which were identified as relevant for inclusion in the indicator framework but are not currently reportable (see Figure 1.3).
This framework is intended to be flexible and updated as new evidence becomes available about linkages between emerging environmental issues and their impact on health.
Figure 1.2 Reportable climate change and environmental health indicators by domain and sub domain
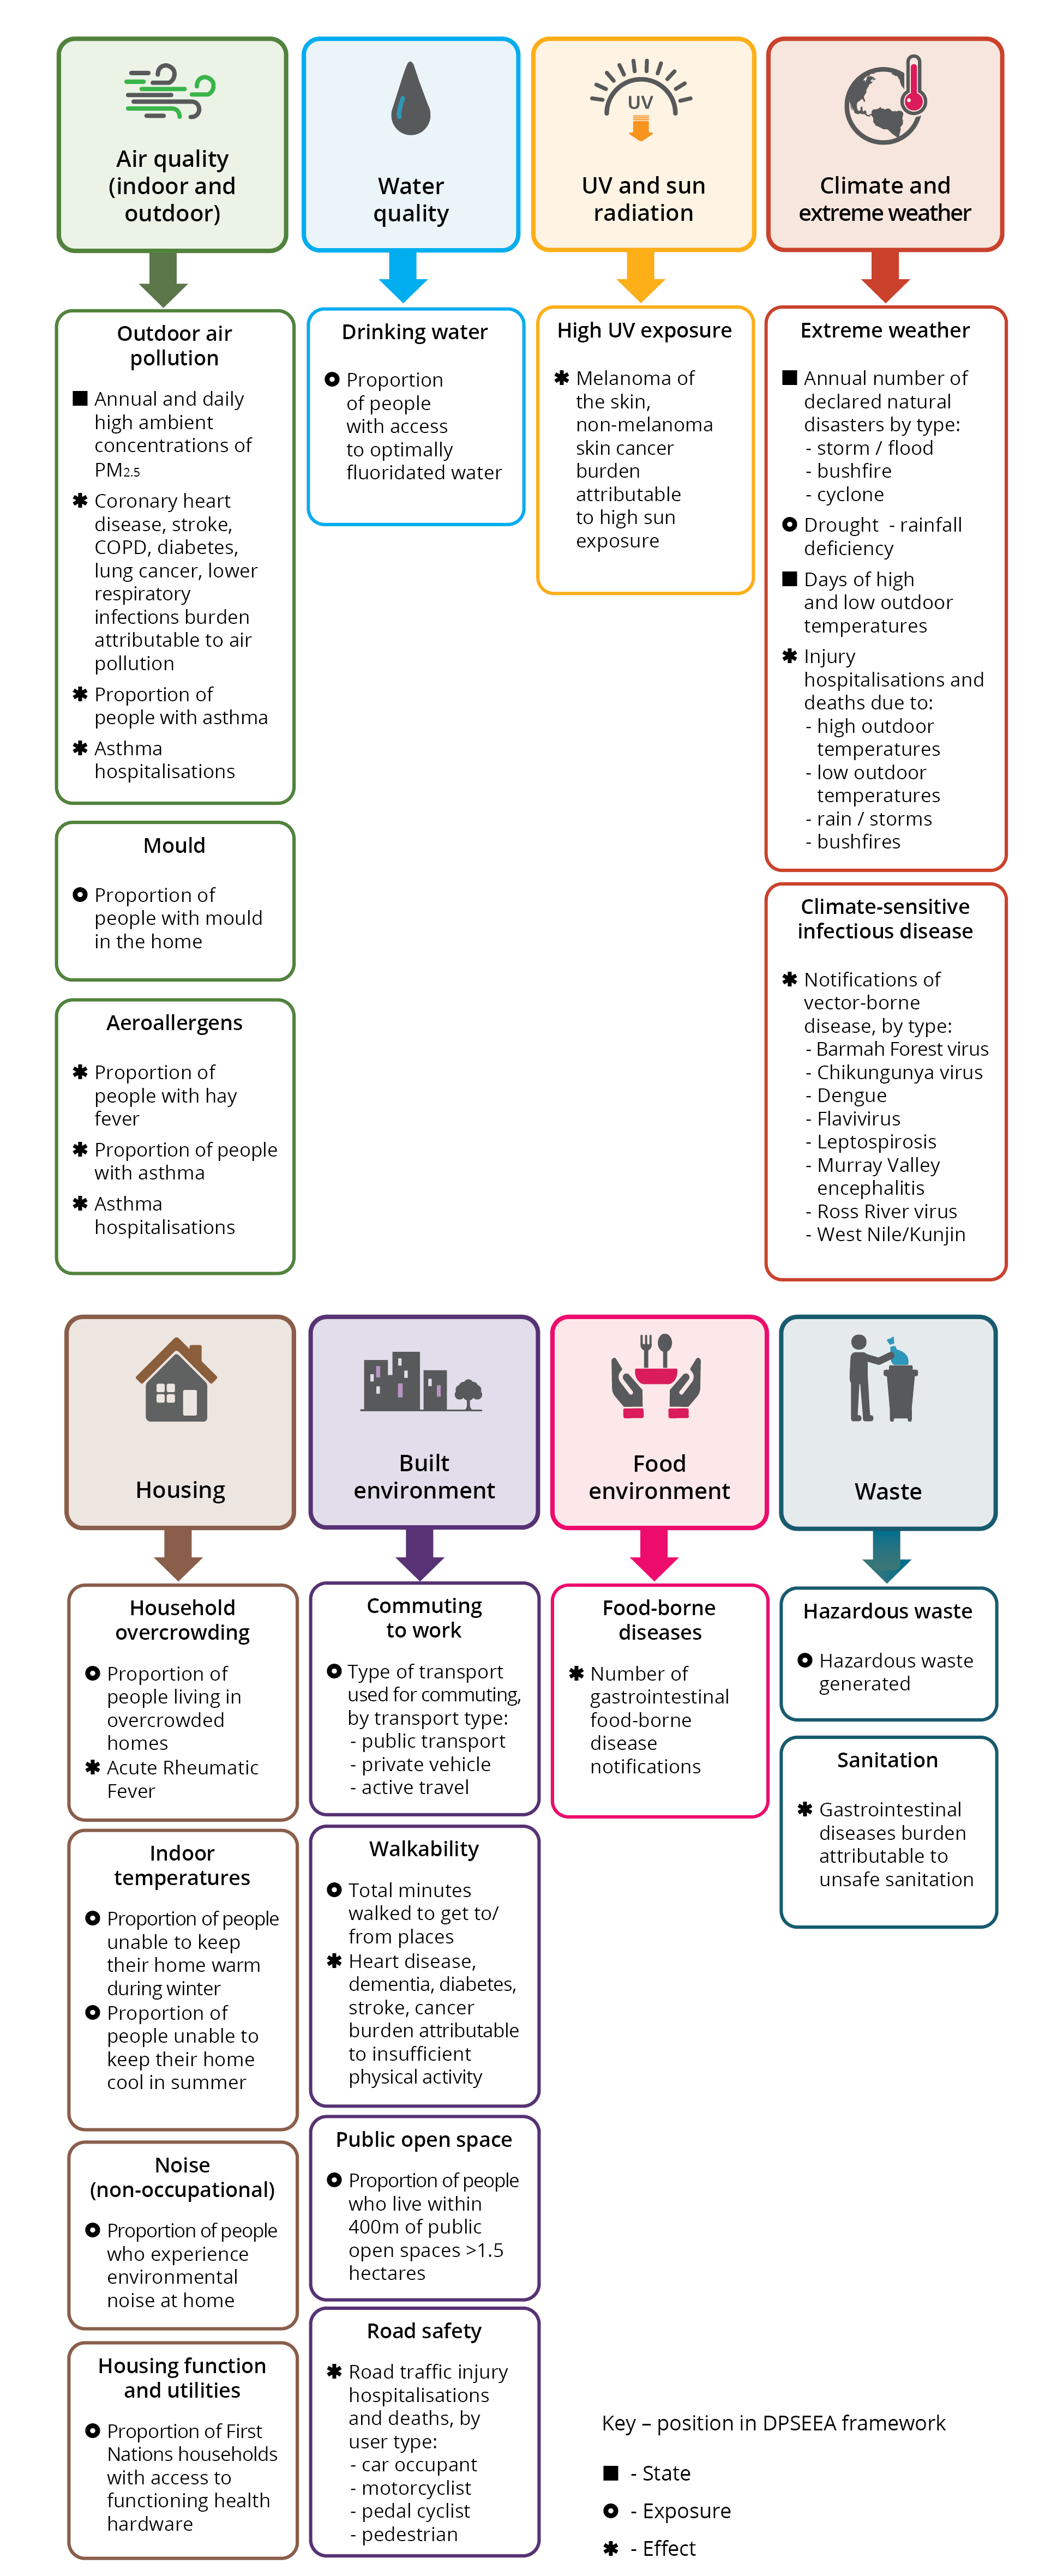
Source: Australian Institute of Health and Welfare
Note: Figure 1.2 is also available in a PDF document on the Related material page.
Figure 1.3: Environmental health indicators by each domain and sub domain that have data gaps or require data development
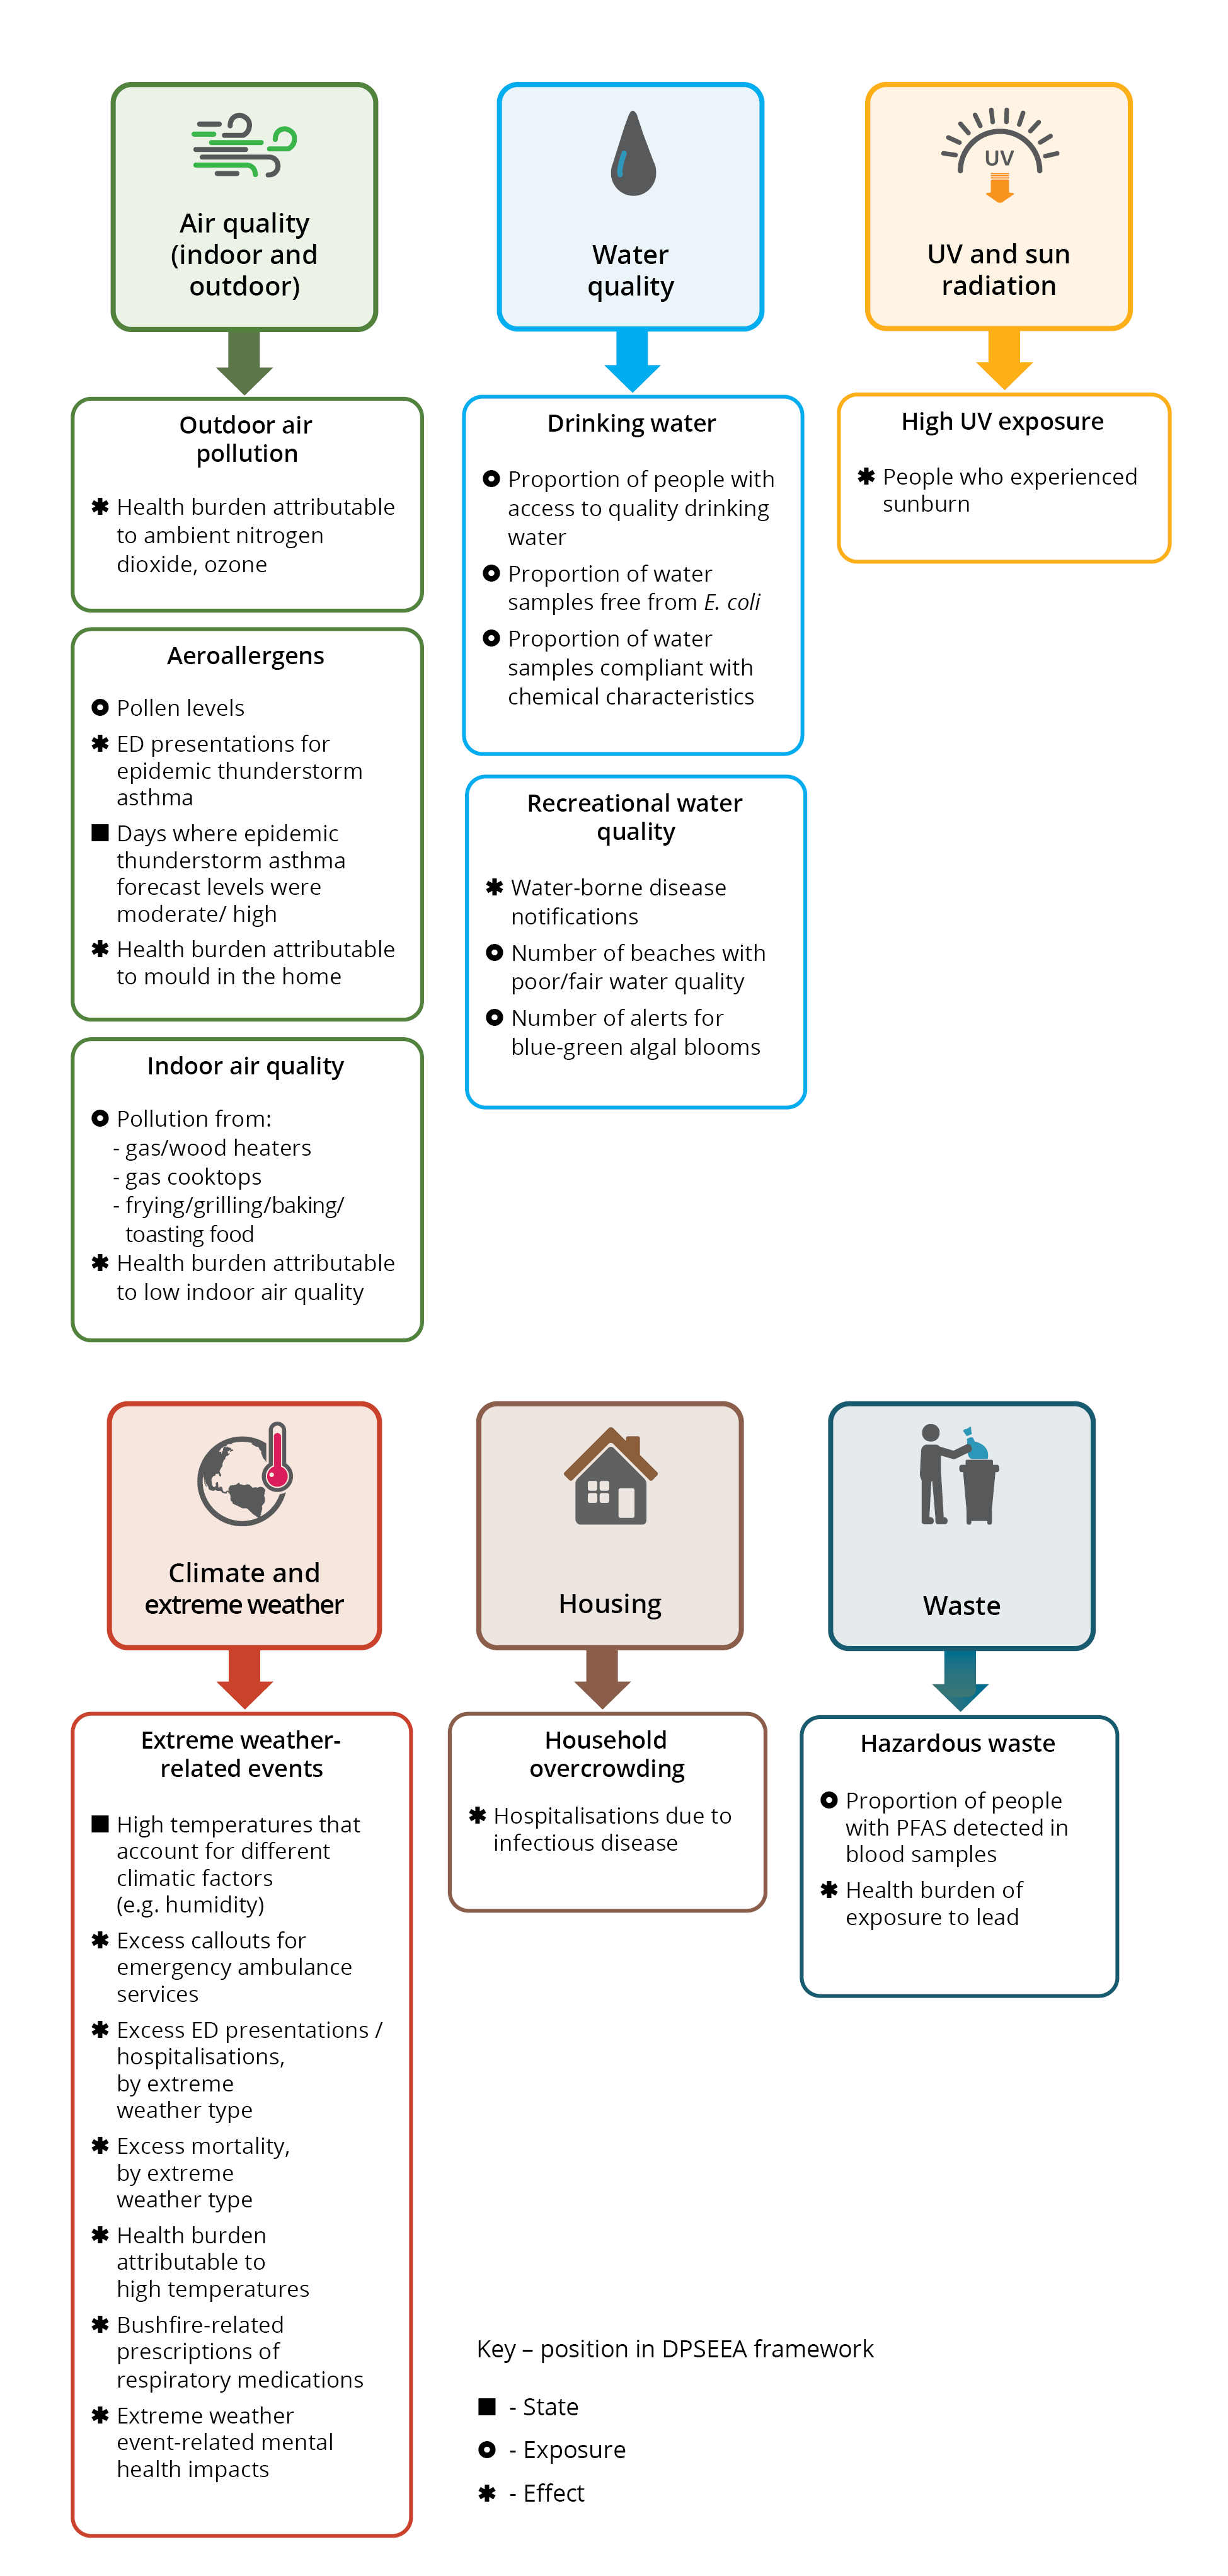
Source: Australian Institute of Health and Welfare
Note: This list of indicators is not exhaustive, rather a select relevant list. It is anticipated that this list will be further developed and expanded over time.
ED – emergency department
PFAS – Per- and polyfluorinated substances.
Note: Figure 1.3 is also available in a PDF document on the Related material page.
Design
As a final step indicator profile tables were developed for each of the reportable indicators. The table contains the technical specifications of the indicator, including:
- the rationale for the inclusion of the indicator,
- information on the measure used,
- the data sources and frequency,
- possible disaggregations to examine differences among specific groups,
- a summary of specific issues relating to the indicator.
Next steps
Reporting of these indicators will:
- provide a cohesive national approach for collection of data and future reporting on environmental determinants of health.
- enable monitoring of the impacts of climate change on health, and evaluation of the success of strategies, policies and/or measures implemented to mitigate or improve the impacts of the environment on human health.
- align Australia with other countries, regions and organisations that use indicators to measure and monitor environmental determinants of health, such as the United States, New Zealand, Europe, and the World Health Organization (Briggs 1999; CDC 2023; EEA n.d.; EHINZ n.d.; Environment and Health Fund and Ministry of Health 2020; OECD n.d.; WHO 2000).