How many people are living with chronic kidney disease in Australia?
Page highlights:
- 1.7 million Australians aged 18 and over had biomedical signs of chronic kidney disease in 2011–12 – 11% of the adult population.
- Only 6.1% of adults with biomedical signs of chronic kidney disease self-reported having the condition.
- The prevalence of chronic kidney disease remained stable between 1999–2000 and 2011–12.
Variation between population groups
- An estimated 18% of Aboriginal and Torres Strait Islander adults (59,600 people) had biomedical signs of chronic kidney disease in ABS 2012–13.
Chronic kidney disease (CKD) is a growing health problem in Australia. Due to our ageing population, its prevalence – the total number of cases – is likely to continue increasing. This web page presents data on prevalence of CKD.
Due to the asymptomatic nature of CKD, and because diagnosis requires the presence of measured biomedical markers that persist for at least 3 months, people often do not realise they have the disease. As a result, numbers based on self-report are often underestimates of the true number of people living with CKD in Australia. Accurate estimates of the prevalence of CKD require large-scale surveys of biomedical markers of kidney function in the population.
The Australian Bureau of Statistics (ABS) 2011–12 National Health Measures Survey (NHMS) is the most recent national survey to date to include biomedical testing for markers of CKD (ABS 2013). The following section reports on the number of Australians who showed biomedical signs of CKD in the 2011–12 NHMS; these data should not be compared with numbers reflecting self-reported CKD.
An estimated 1.7 million Australians aged 18 and over had biomedical signs of chronic kidney disease in 2011–12, representing 11% of the adult population, according to the most recently available data (AIHW analysis of ABS 2013).
Only 6.1% of adults with biomedical markers of CKD self-reported having the condition in 2011–12, indicating that the majority of CKD in Australia is undiagnosed (ABS 2013).
Variation by age and sex
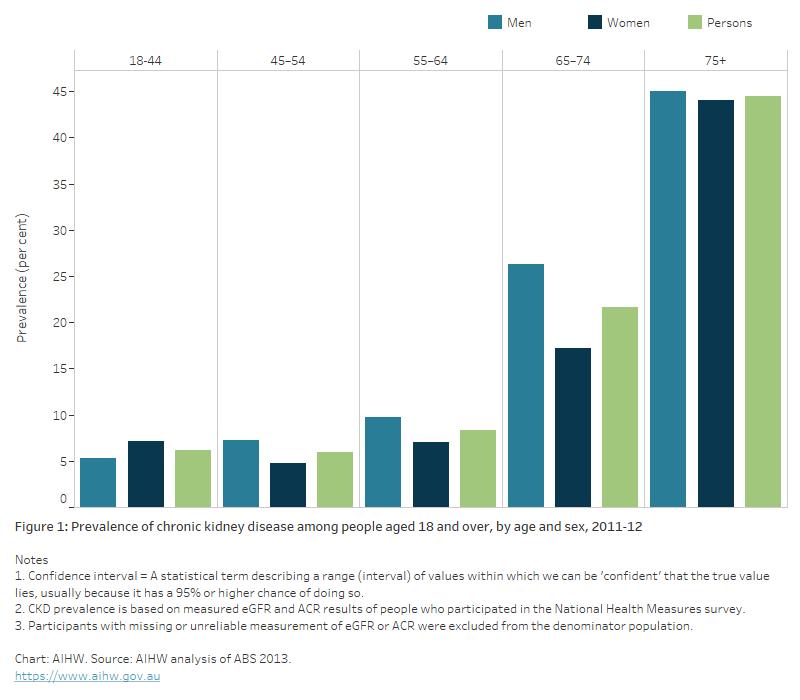
In 2011–12, the prevalence of biomedical signs of CKD among adults aged 18 and over:
- was around 11% for both men and women (AIHW analysis of ABS 2013)
- increased rapidly after age 74, with rates among those aged 75 and over being twice as high (44%) as rates for people aged 65–74 (22%) (Figure 1).
Figure 1: Prevalence of chronic kidney disease among people aged 18 and over, by age and sex, 2011–12
The bar chart shows the percentage of adults aged 18 and over who showed biomedical signs of CKD in the 2011-12 National Health Measures Survey. Males had a higher prevalence than females across all age groups except 18 to 44 year-olds, where CKD was slightly more prevalence in females (7.1%) than males (5.3%). Prevalence increased with age, and rapidly after age 65. People aged 75 and over showed the highest prevalence of biomedical signs of CKD.
Stages of chronic kidney disease
Stages 1 and 2
eGFR ≥ 60, with albuminuria, haematuria, or a pathological or structural abnormality
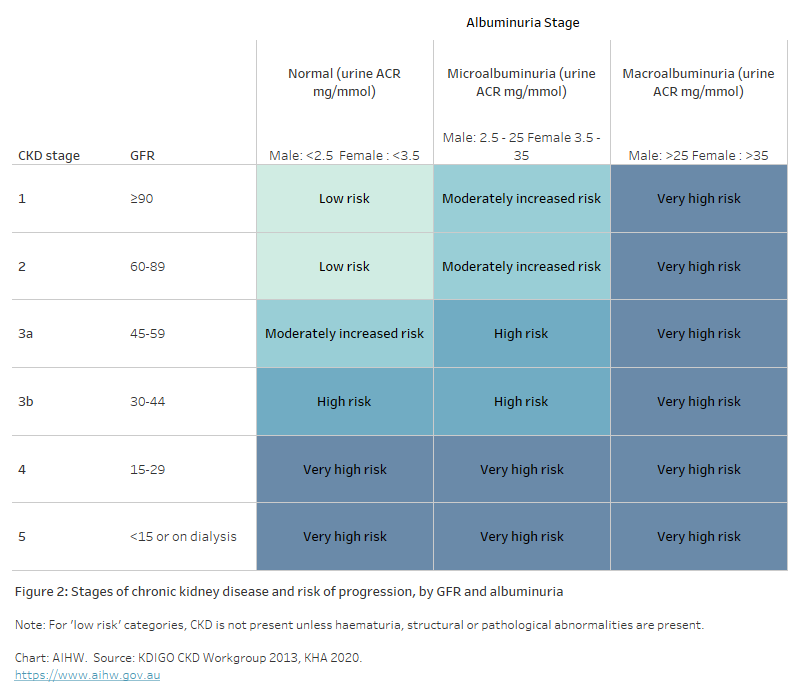
There are usually no symptoms, as the kidneys are still able to function adequately when they are slightly damaged. This makes diagnosis difficult. The estimated glomerular filtration rate (eGFR) is normal (≥90mL/min/m2; stage 1) or slightly reduced (between 60 and 89 mL/min/m2; stage 2). The risk of disease progression depends on albuminuria levels (Figure 2).
Stages 3 and 4
eGFR between 15 and 59, with or without albuminuria
The level of waste (urea and creatinine) in the blood rises and a person may start to feel unwell. Kidney function is reduced and blood pressure rises. This is usually when diagnosis occurs. Stage 3 is marked by a moderate reduction in eGFR (between 30 and 59 mL/min/m2) and is divided into stage 3a and 3b. Stage 4 is marked by a severe reduction in eGFR (between 15 and 29 mL/min/m2). In these stages, the risk of progression can depend on both GFR and albuminuria.
Stage 5 – kidney failure (also known as end-stage kidney disease)
eGFR < 15 or on dialysis
This is marked by substantial loss of kidney function. The kidneys are no longer able to adequately filter waste from the blood and the person requires kidney replacement therapy – either dialysis or a kidney transplant – to stay alive. The risk of progression is very high.
Figure 2: Stages of chronic kidney disease and risk of progression, by GFR and albuminuria
The table shows the categorisation of kidney function stage according to glomerular filtration rate (GFR) and albuminuria stage. Albuminuria stage is categorised as normal, microalbuminuria and macroalbuminuria according to urine ACR (mg/mmol). Kidney function stage 1 is defined by GFR greater than or equal to 90, stage 2 is GFR 60 to 89, stage 3a is GFR 45 to 59, stage 3b is GFR 30 to 44, stage 4 is GFR 15 to 29 and stage 5 is defined by GFR less than 15 or receiving dialysis.
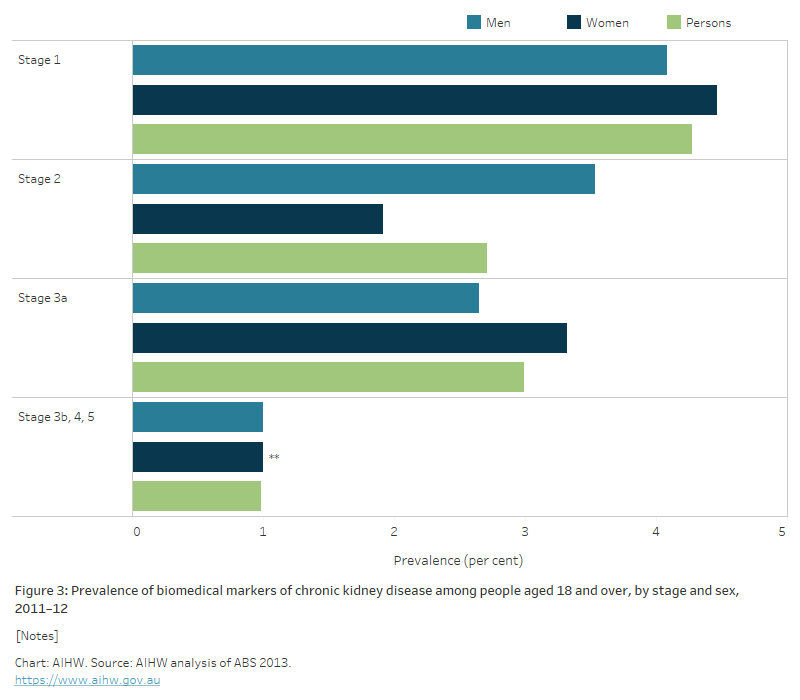
In 2011–12, 97% of adults with biomedical signs of CKD were in stages 1 to 3 of the disease (ABS 2013):
- 7.0% (1.1 million people) had biomedical signs indicating stage 1 or 2 CKD
- 3.0% (466,700 people) had biomedical signs indicating stage 3a CKD
- 1.0% (154,200 people) had biomedical signs indicating stage 3b and stages 4 to 5 CKD (Figure 3).
Figure 3: Prevalence of biomedical markers of chronic kidney disease among people aged 18 and over, by stage and sex, 2011–12
The bar chart shows the percentage of adults aged 18 and over who showed biomedical signs of CKD in the 2011-12 National Health Measures Survey. The proportion of people with signs of CKD decreased with the severity of the disease indicators from around 4% showing signs of Stage 1, to around 1% showing signs of Stages 3b, 4 and 5 (combined).
CKD prevalence is closely related to age. In 2011–12:
- 6.6% of people aged 18–64 showed biomedical signs of CKD, compared with 31% of those aged 65 and over
- 70% of adults with CKD stages 1 and 2 were aged 18–64
- 88% of adults with CKD stages 3 to 5 were aged 65 and over.
Trends over time
Two national surveys have been conducted in Australia that provide data on biomarkers of CKD – the 1999–2000 Australian Diabetes, Obesity and Lifestyle Study (AusDiab) and the 2011–12 NHMS (ABS 2013). Because the AusDiab study included participants aged 25 and over only, comparisons over time between it and the NHMS do not include adults aged 18–24. For more information on methods for these trends see: Chronic kidney disease prevalence among Australian adults over time.
Note that the ABS is currently undertaking a multi-year Intergenerational Health and Mental Health Study in 2020–2024, which will include a new NHMS and a new National Aboriginal and Torres Strait Islander Health Measures Survey (ABS 2022).
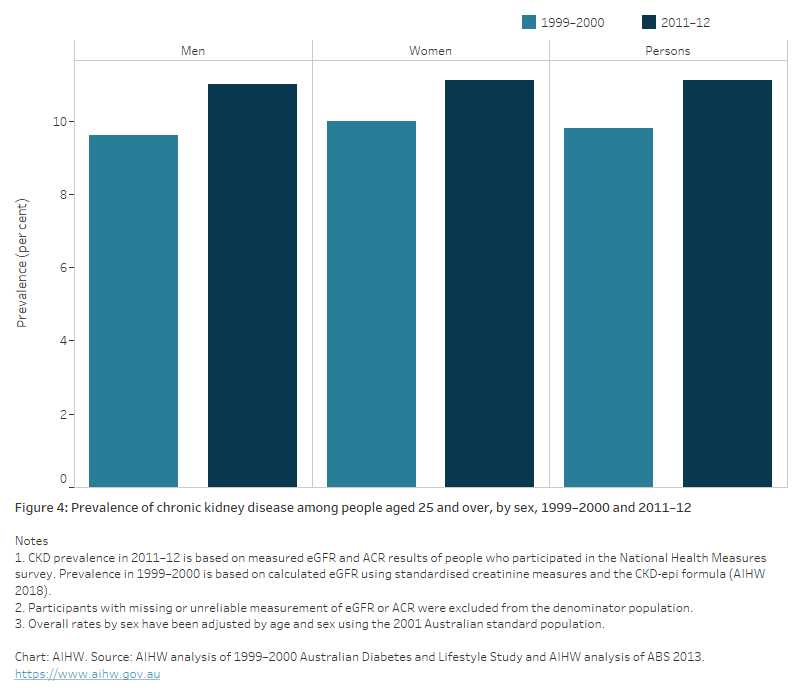
Between 1999–2000 and 2011–12, CKD prevalence remained stable, at around 10% among adults aged 25 and over (AIHW 2018). There was no difference between men and women in the prevalence of CKD in both surveys (Figure 4).
Figure 4: Prevalence of chronic kidney disease among people aged 25 and over, by sex, 1999–2000 and 2011–12
The bar chart shows the percentage of adults aged 25 and over who showed biomedical signs of CKD in two national surveys – the AusDiab Study in 1999-2000 and the National Health Measures Survey in 2011-12, by sex. For both males and females, the proportion of the population with signs of CKD remained stable between the 2 surveys, at around 10% of the population.
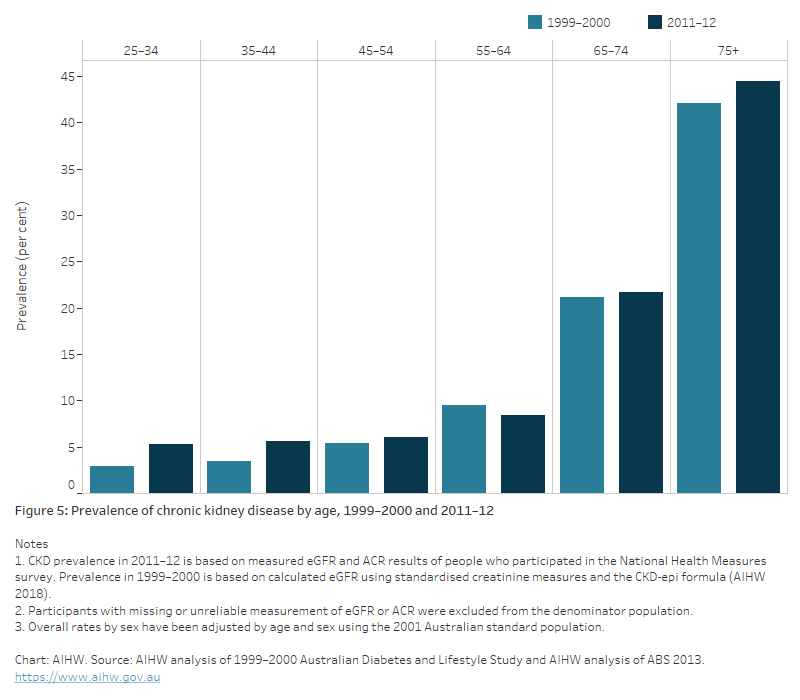
The age pattern between both surveys was similar, with CKD prevalence increasing gradually until age 64, and sharply from age 65; however, there was a significant increase in CKD prevalence in those aged 25–44 in 2011–12 compared with 1999–2000 (AIHW 2018) (Figure 5).
Figure 5: Prevalence of chronic kidney disease by age, 1999–2000 and 2011–12
The bar chart shows the percentage of adults aged 25 and over who showed biomedical signs of CKD in two national surveys – the AusDiab Study in 1999-2000 and the National Health Measures Survey in 2011-12, by age. The proportion of the population with signs of CKD remained stable between the 2 surveys, increasing with age, particularly from age 65. The highest prevalence was in people aged 75 and over (around 44.5% in 2011-12).
The number of Australians with stages 3 to 5 CKD nearly doubled between 1999–2000 (322,000) and 2011–12 (604,000) (AIHW 2018). This increase was mostly driven by an increase in CKD stage 3, due to growth in the size of the population aged 65 and over.
Variation between population groups
Aboriginal and Torres Strait Islander people
An estimated 18% of Indigenous Australian adults (59,600 people) had biomedical signs of CKD, according to the ABS 2012–13 National Aboriginal and Torres Strait Islander Health Measures Survey (ABS 2014).
Indigenous adults were twice as likely as non-Indigenous adults to have biomedical signs of CKD, after accounting for differences in the age structure of the populations.
Remoteness and socioeconomic area
After adjusting for differences in the age structures of the population, the prevalence of biomedical signs of CKD among adults in 2011–12:
- was 1.3 times as high in Outer regional and remote areas as in Major cities
- was 1.5 times as high in the lowest socioeconomic areas as in the highest socioeconomic areas (Figure 6).
See Geographical variation in disease: diabetes, cardiovascular and chronic kidney disease for more information on the prevalence of CKD by state/territory, Population Health Network and Population Health Area.
Figure 6: Prevalence of chronic kidney disease among people aged 18 and over, by remoteness and socioeconomic area, 2011–12
The bar chart shows the age-standardised percentage of males, females and the total, aged 18 and over with biomedical signs of CKD in 2011-12, by remoteness and socioeconomic area. The prevalence of signs of CKD was similar across remoteness areas, but was highest in people living in the most disadvantaged socioeconomic areas.

Further information
For more information on the prevalence of CKD, see:
ABS (Australian Bureau of Statistics) (2013) Australian Health Survey: biomedical results for chronic diseases, ABS, Australian Government, accessed 22 February 2022.
ABS (2013) Microdata: Australian Health Survey, Core Content – Risk Factors and Selected Health Conditions, 2011–12, AIHW analysis of detailed microdata, accessed 20 October 2021.
ABS (2014) Australian Aboriginal and Torres Strait Islander health survey: biomedical results, 2012–13, ABS, Australian Government, accessed 18 March 2022.
ABS (2018) Kidney disease, ABS, Australian Government, accessed 18 March 2022.
ABS (2022) Intergenerational Health and Mental Health Study (IHMHS), ABS, Australian Government, accessed 10 May 2022.
AIHW (Australian Institute of Health and Welfare) 2018 Chronic kidney disease prevalence among Australian adults over time, AIHW, Australian Government, accessed 13 May 2022.
Kidney Disease: Improving Global Outcomes (KDIGO) CKD Work Group, KDIGO 2012 Clinical Practice Guideline for the Evaluation and Management of Chronic Kidney Disease, Kidney inter., Suppl. 2013; 3: 1–150.
KHA (Kidney Health Australia) (2020) Stages of kidney disease, Kidney Health Australia website, accessed 11 April 2022.


