Housing affordability
Web article
Release Date:
Section: Housing
Citation
AIHW
Australian Institute of Health and Welfare (2024) Housing affordability, AIHW, Australian Government, accessed 27 July 2024.
APA
Australian Institute of Health and Welfare. (2024). Housing affordability. Retrieved from https://www.aihw.gov.au/reports/australias-welfare/housing-affordability
MLA
Housing affordability. Australian Institute of Health and Welfare, 12 July 2024, https://www.aihw.gov.au/reports/australias-welfare/housing-affordability
Vancouver
Australian Institute of Health and Welfare. Housing affordability [Internet]. Canberra: Australian Institute of Health and Welfare, 2024 [cited 2024 Jul. 27]. Available from: https://www.aihw.gov.au/reports/australias-welfare/housing-affordability
Harvard
Australian Institute of Health and Welfare (AIHW) 2024, Housing affordability, viewed 27 July 2024, https://www.aihw.gov.au/reports/australias-welfare/housing-affordability
Get citations as an Endnote file: Endnote

Housing affordability
is an Australia's welfare
topic
Access to good quality, affordable housing is fundamental to wellbeing. It can help reduce poverty and enhance equality of opportunity, social inclusion and mobility (Gurran et al. 2021; Maclennan et al. 2019). Affordability is important for both Australians wanting to buy a home and for those renting. Many factors influence the supply, demand and cost of housing, including Australia’s growing and ageing population and government policies (AIHW 2023; Burke et al. 2020; Gurran et al. 2021).
Housing affordability typically refers to the relationship between expenditure on housing (prices, mortgage payments or rents) and household incomes (Thomas and Hall 2016). Home ownership and housing tenure and Housing assistance are related to housing affordability.
The cost of housing
Purchasing a home
House prices have risen across Australia over the decade to 2024. The median transfer price for established houses in capital cities increased substantially, with the median real house transfer price in Sydney increasing from around $615,000 in the first quarter of 2013 to around $1.3 million at the end of 2023 (ABS 2024a). Median transfer house prices in Canberra ($980,000) were the second highest among the capital cities at the end of 2023, followed by Melbourne ($840,000) and Brisbane ($830,000), whilst Darwin ($585,000) was the lowest.
The median transfer price of attached dwellings (units, apartments, et cetera) in capital cities also generally increased since 2013. Sydney prices increased from $520,000 at the start of 2013 to $780,000 at the end of 2023 (ABS 2024a). Melbourne ($615,000) was the second most expensive for units/apartments at the end of 2023, followed by Canberra ($610,000) and Adelaide ($556,000).
The price paid for housing in non-capital city areas has also increased, however, in general housing is less expensive than in capital city areas.
Throughout 2023, house prices have risen compared to the same time period in 2022 (CoreLogic 2024). At the same time, interest rates have increased (RBA 2024). Since 2021, housing costs as a share of income have risen considerably faster for households with a mortgage than for households that rent due to rises in interest rates (Phillips 2023).
Cost of rental accommodation
Around one-third (31%) of households in Australia were renting in 2019–20 (ABS 2022a). The cost of private rental accommodation has increased substantially over recent years, especially after the COVID-19 pandemic.
Over the 12-months to September 2023, median advertised rents increased by 10.0% in capital city areas, with strong increases in Perth (13.2%) and Melbourne (12.0%) (CoreLogic 2023). Canberra (-3.0%) and Hobart (-1,7%) were the only capital city areas where advertised rents fell.
Advertised rents are important to understand potential barriers faced by people seeking a new rental lease, however, rental affordability is broader than advertised rents. That is, rents paid by existing and new tenants are important to understand housing affordability in context with other cost of living pressures.
Across Australia, rents paid increased by 7.8% from the first quarter of 2024 compared with the first quarter of 2023 (ABS 2024b). All capital cities except Hobart (-0.4%) experienced an annual increase in rents, ranging from a 9.9% increase in Perth to 1.7% in Canberra.
How is housing affordability measured?
Measuring housing affordability is not straightforward. A household’s financial situation, the overall demand in the housing market and housing tenure type (whether a household is seeking to rent, is renting, is looking to buy or is a home owner with or without a mortgage) all influence individual housing affordability (Senate Standing Committees on Economics 2015). The simplest measure of housing affordability compares housing costs to gross household income.
Measures relating to housing affordability
Housing affordability can be expressed as the ratio of housing costs to gross household income (ABS 2022a).
Housing costs are defined as the sum of rent payments, rate payments (water and general), and housing–related mortgage payments (ABS 2022a).
Housing stress is typically described as lower-income households that spend more than 30% of gross income on housing costs (ABS 2022a).
How much do we spend on housing?
In 2019–20, 10.5% of households spent more than 30% to 50% of gross income on housing costs and 5.7% of households spent 50% or more. These proportions have increased from 10.2% and 5.2% respectively since 2007–08 (Table 1).
Per cent of income spent on housing costs | 2007–08 | 2013–14 | 2019–20 |
|---|---|---|---|
More than 50 (more likely to be in financial stress) | 5.2 | 5.7 | 5.7 |
More than 30 to 50 | 10.2 | 12.0 | 10.5 |
More than 25 to 30 | 6.4 | 7.2 | 7.2 |
25 or less (less likely to be in financial stress) | 78.2 | 75.1 | 76.6 |
Note: Excludes households with nil or negative income.
Source: ABS 2022a.
The proportion of household income spent on housing costs in Table 1 does not consider that high-income households may choose to spend more than 30% of their household income on housing. Their higher income means they have sufficient income after housing costs to avoid financial stress (AHURI 2019; Rowley et al. 2015).
By contrast, low-income households (a household with equivalised disposable income falling between 3rd to 20th percentile of households) are more likely to lack the resources to deal with financial impacts arising from critical life events and/or housing market factors, often leading them to need additional housing assistance (AIHW 2023).
Housing stress among low-income households
Around 1.0 million low-income households were in financial housing stress in 2019–20, spending more than 30% of their income on housing (ABS 2022a). More than half (58%) of low‑income households in the private rental market were in housing stress, compared with home owners with a mortgage (37%) and home owners without a mortgage (0.9%) (Table 2).
| Low-income household characteristic | Households spending more than 30% of income on housing (%) |
|---|---|
Owner without a mortgage | 0.9 |
Owner with a mortgage | 37.4 |
Private renter | 58.0 |
Family households: Couple family with dependent children | 30.3 |
Family households: One parent family with dependent children | 41.8 |
Family households: Couple only family | 15.4 |
Family households: Other one family households | 16.2 |
Family households: Multiple family households | 8.4* |
Group households | 51.3* |
Lone person households | 25.7 |
All households | 25.1 |
*Estimate has a high margin of error and should be used with caution.
Notes
- Due to limitations of housing costs information, care should be taken when comparing costs of different tenure and landlord types.
- Housing costs as a proportion of gross household income is the sum of housing costs of a group divided by the summed gross weekly income of that group of households.
- Cells in this table have been randomly adjusted (by perturbation) to avoid the release of confidential data.
Source: ABS 2022a.
Geographic variation of housing affordability
Housing costs and incomes vary across Australia, meaning housing affordability differs within and between states and territories and among housing tenure types (for example, home owners with a mortgage or renters).
Housing costs
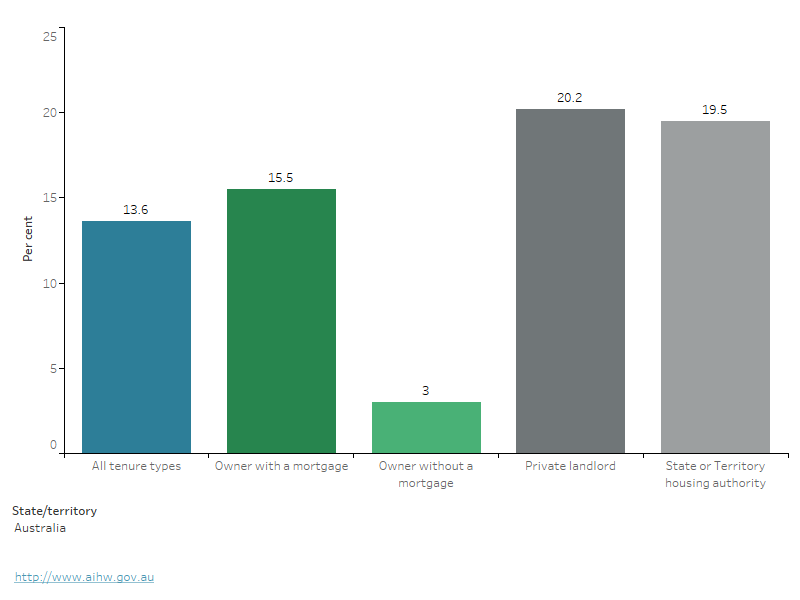
Housing costs as a proportion of income varied across Australia and between landlord types. In 2019–20:
- for all households, housing costs as a proportion of income was highest in New South Wales (14.7%) and lowest in Western Australia (12.1%)
- for homeowners with a mortgage, housing costs were highest in New South Wales (17.0%) and lowest in Western Australia (14.0%)
- for private renters, housing costs were highest in New South Wales (22.2%) and lowest in Western Australia (17.4%) (Figure 1).
Figure 1: Housing costs as a proportion of gross household income, by housing tenure type and state and territories, 2019–20
Column graph shows housing costs are 13.6% of gross household income in Australia for all tenure types in 2019–20.
Notes
- # indicates that the proportion has a high margin of error. Caution should be taken when interpreting the data.
- Data have been randomly adjusted (by perturbation) to avoid the release of confidential data.
Source: ABS 2022a.
Rental stress among low‑income households
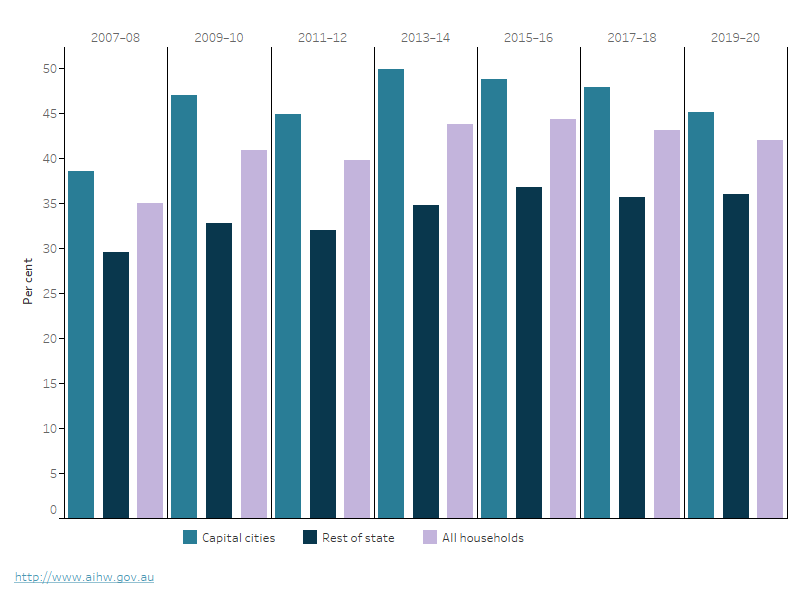
For low-income households in the private rental market, the proportion in rental stress (based on the 30/40 rule) varied between capital city and rest of state areas (ABS 2022a):
- In greater capital city areas, the percentage of low-income households experiencing rental stress increased from 38.5% in 2007–08 to 45.1% in 2019–20.
- Outside greater capital city areas, the percentage of low-income households experiencing rental stress increased from 29.5% in 2007–08 to 36.0% in 2019–20 (Figure 2).
Figure 2: Proportion of low‑income households in rental stress, by household location, 2007–08 to 2019–20
Column graph shows the proportion of low‑income households in rental stress has fluctuated over time.
Notes
- Low-income households in rental stress in this figure are defined as the 40% of households with equivalised disposable household income (excluding Commonwealth Rent Assistance) spending more than 30% of their gross income on housing costs. Values are calculated for greater capital city areas and rest of state, on a state‑by‑state basis.
- Households in Northern Territory SA1s defined as very remote were excluded, accounting for 22% of the population of the NT.
Source: ABS 2022a.
Rental affordability index
The rental affordability index (see glossary) is a price index for housing rental markets across geographical areas in Australia, calculated using median incomes. A rental affordability index score of 81–100 represents unaffordable rent (that households spend 30 percent or more of their income on rent), a score between 101 and 120 represents moderately unaffordable rent, a score between 121 and 150 represents acceptable rent and a score greater than 151 represents affordable rents (SGS Economics and Planning 2023).
In general, rental affordability index scores are worse for the rest of the state or territory compared with metropolitan areas. As at June 2023:
- Sydney and Hobart were the least affordable metropolitan areas in Australia.
- Melbourne was the most affordable metropolitan area in Australia.
- Affordability in all metropolitan areas decreased further compared with 2022 trends, in all cities except Hobart.
- Regional Queensland was the least affordable of the rest of states and territories.
- Regional South Australia was the most affordable of the rest of state areas (Table 3).
Very low‑income households continue to face unaffordable rent in most capital cities (Baker et al. 2020).
Region | Rental affordability index | Proportion of household income spent on rent | Relative unaffordability |
|---|---|---|---|
Greater Sydney | 104 | 29 | Moderately unaffordable rents |
Rest of New South Wales | 102 | 29 | Moderately unaffordable rents |
Greater Melbourne | 126 | 24 | Acceptable rents |
Rest of Victoria | 112 | 27 | Moderately unaffordable rents |
Greater Brisbane | 108 | 28 | Moderately unaffordable rents |
Rest of Queensland | 100 | 30 | Moderately unaffordable rents |
Greater Perth | 112 | 27 | Moderately unaffordable rents |
Rest of Western Australia | 123 | 24 | Acceptable rents |
Greater Adelaide | 109 | 27 | Moderately unaffordable rents |
Rest of South Australia | 126 | 24 | Acceptable rents |
Greater Hobart | 104 | 29 | Moderately unaffordable rents |
Rest of Tasmania | 107 | 28 | Moderately unaffordable rents |
Australian Capital Territory | 125 | 24 | Acceptable rents |
Note: Data for the Northern Territory are not available.
Source: SGS Economics and Planning 2022.
Where do I go for more information?
For more information on housing affordability, see:
- Housing assistance in Australia
- Housing data dashboard
- Australian Bureau of Statistics (ABS) Housing Occupancy and Costs, financial year 2019-20
For more on this topic, see Housing assistance.
ABS (Australian Bureau of Statistics) (2022a) Housing Occupancy and Costs, 2019–20 financial year, ABS website, accessed 16 April 2024.
ABS (2022b) Income, ABS website, accessed 19 April 2024.
ABS (2024a) Total value of dwellings - reference period December quarter 2023, ABS, accessed 16 April 2024.
ABS (2024b) Consumer price index Australia , ABS, accessed 9 April 2024.
AHURI (Australian Housing and Urban Research Institute) (2019) Mortgage stress, rental stress, housing affordability stress: what’s the difference?, AHURI website, accessed 16 April 2024.
AIHW (Australian Institute of Health and Welfare) (2023) Housing Assistance in Australia, AIHW, Australian Government, accessed 9 April 2024.
Baker E, Daniels L, Pawson H, Baddeley M, Vij A, Stephens M, Phibbs P, Clair A, Beer A, Power E, Bentley R, Kulik C, Sinha R, Stone W, Dignam J, London K, Rowley S, Hulse K, Nygaard C, Holst H, Leishman C, Rogers D, Jacobs K, Beer A and Bentley R (2020) Rental Insights: A COVID-19 Collection, AHURI, Melbourne, doi:10.18408/ahuri3125402.
Burke T, Nygaard C and Ralston L (2020) Australian home ownership: past reflections, future directions, AHURI Final Report No 328, AHURI, Melbourne, doi:10.18408/ahuri-5119801.
CoreLogic (2023) Quarterly Rental Review - quarter 3 2023, accessed 9 April 2024.
CoreLogic (2024) Hedonic Home Value Index CoreLogic, accessed 9 April 2024.
CoreLogic (2024b) Australia’s median rent hits new record, surpasses $600 per week, CoreLogic, accessed 18 April 2024.
Gurran N, Hulse K, Dodson J, Pill M, Dowling R, Reynolds M and Maalsen S (2021) Urban productivity and affordable rental housing supply in Australian cities and regions, AHURI Final Report No 353, AHURI, Melbourne, doi: 10.18408/ahuri5323001.
Maclennan D, Randolph B and Crommelin (2019) Strengthening Economic Cases for Housing Policies, UNSW (University of New South Wales) Sydney, City Futures Research Centre, UNSW website.
Phillips B (2023) Housing costs trends and projections: Research note, Centre for Social Research and Methods, Australian National University.
RBA (Reserve Bank of Australia) (2024) Housing Lending Rates– F6 [statistical tables], RBA, Sydney, accessed 9 April 2024.
Rowley S, Ong Viforj R and Haffner M (2015) Bridging the Gap between Housing Stress and Financial Stress: The Case of Australia, Housing Studies, 30(3):473–490, doi: 10.1080/02673037.2014.977851.
Senate Standing Committees on Economics (2015) Out of Reach? The Australian housing affordability challenge, Parliament of Australia, accessed 16 April 2024.
SGS Economics and Planning (2023) Rental Affordability Index: November 2023 key findings, SGS Economics and Planning website, accessed 15 April 2024.
Thomas M and Hall A (2016) Housing affordability in Australia, Parliament of Australia, accessed 16 April 2024.