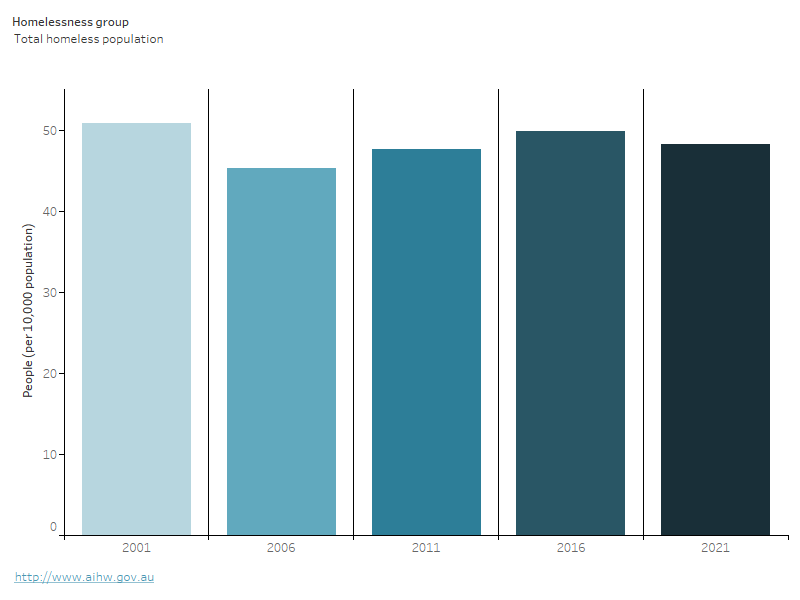
Note: Homelessness groups are mutually exclusive, therefore persons will only appear in one category.
Source: ABS 2023.
Homelessness services
SHS agencies receive government funding to provide assistance to both people experiencing and people at risk of homelessness. The services are aimed at prevention, early intervention, crisis and post crisis assistance and include accommodation-related services and personal services. SHS agencies vary in size and in the types of assistance provided.
In 2022–23, about 274,000 clients were assisted; a rate of 105.2 clients per 10,000 population, or 1.1% of the Australian population (AIHW 2023). Most clients were at risk of experiencing homelessness (53% or 130,000 clients) when first presenting to SHS. Another 116,000 clients (47%) were homeless. Housing status at the start of support was unknown for around 27,000 SHS clients.
SHS agencies have supported more than 1.6 million Australians since the collection began on 1 July 2011 (AIHW 2023).
Characteristics of SHS clients
Of the 274,000 clients SHS agencies assisted in 2022–23:
- 6 in 10 were female (59% or 162,000 clients)
- 1 in 6 were children under the age of 10 (16% or 43,200 clients)
- 1 in 10 were children and youth aged 10–17 (12% or 32,800 clients)
- the largest age group of adult clients was those aged 25–34 (18% of all clients or 50,000 clients)
- about 14,400 were women aged 55 or older (8.8% of total female clients) and 12,900 were men aged 55 or older (12% of total male clients)
- 1 in 3 (35% or 90,100) clients were living as a single parent with one or more children when they sought support (AIHW 2023).
Australians known to be at particular risk of homelessness include those who have experienced family and domestic violence, young people, children on care and protection orders, First Nations people, people leaving health or social care arrangements, and older Australians.
In 2022–23, around 104,000 SHS clients had experienced family and domestic violence at some point during the reporting period (Table 2). Some SHS client groups were more likely than other groups to be experiencing homelessness at the beginning of support, including clients with problematic drug or alcohol issues (60% of the cohort), young people aged 15–24 presenting alone (55%) and clients who are current or former members of the Australian Defence Force (55%).
Table 2: Characteristics of SHS client groups of interest, 2022–23Client group | Number of clients | Female (%) | Homeless at the beginning of support (%) | Median length of support (days) | Receiving accommodation (%) |
|---|
Family and domestic violence | 104,000 | 75 | 43 | 72 | 39 |
|---|
Current mental health issues | 85,300 | 63 | 51 | 88 | 35 |
|---|
Indigenous Australians | 74,700 | 62 | 50 | 58 | 39 |
|---|
Young people presenting alone
(15–24 years) | 38,300 | 65 | 55 | 64 | 32 |
|---|
Older people (55 years or older) | 27,300 | 53 | 38 | 45 | 19 |
|---|
Problematic drug or alcohol issues | 23,500 | 48 | 60 | 116 | 49 |
|---|
Note: Clients may be in one or more client vulnerability group. Client vulnerabilities groups are domestic and family violence, mental health, and problematic drug and/or alcohol.
Source: AIHW 2023.
Trends in clients assisted by SHS agencies
The number of clients assisted by SHS agencies each year decreased from around 290,000 people in 2018–19 to about 274,000 in 2022–23 (Table 3). Over the same period, the:
- rate of all SHS clients decreased from 116.3 to 105.2 clients per 10,000 population
- number of support days increased by 2.4 million days, from 26.0 to 28.4 million.
Table 3: SHS clients, by number, rate and housing situation at the beginning of support, 2018–19 to 2022–23SHS clients | 2018–19 | 2019–20 | 2020–21 | 2021–22 | 2022–23 |
|---|
Number of clients | 290,317 | 290,462 | 278,275 | 272,694 | 273,648 |
Rate (per 10,000 population)1 | 116.3 | 114.6 | 108.5 | 106.2 | 105.2 |
Homeless (per cent)2 | 44 | 45 | 46 | 46 | 47 |
At risk of homelessness (per cent) 2 | 56 | 55 | 54 | 54 | 53 |
Total days of support (millions) | 26.0 | 26.1 | 27.7 | 28.2 | 28.4 |
Length of support (median number of days) | 44 | 43 | 51 | 53 | 56 |
Median number of nights accommodated | 29 | 28 | 31 | 32 | 31 |
Notes:
- Rates are crude rates based on the Australian estimated resident population (ERP) at 30 June of the reference year. Minor adjustments in rates may occur between publications reflecting revision of the ERP by the Australian Bureau of Statistics.
- Homeless and at risk of homelessness are a client’s housing situation at the beginning of the first support period.
Source: Specialist Homelessness Services Collection 2018–19 to 2022–23.
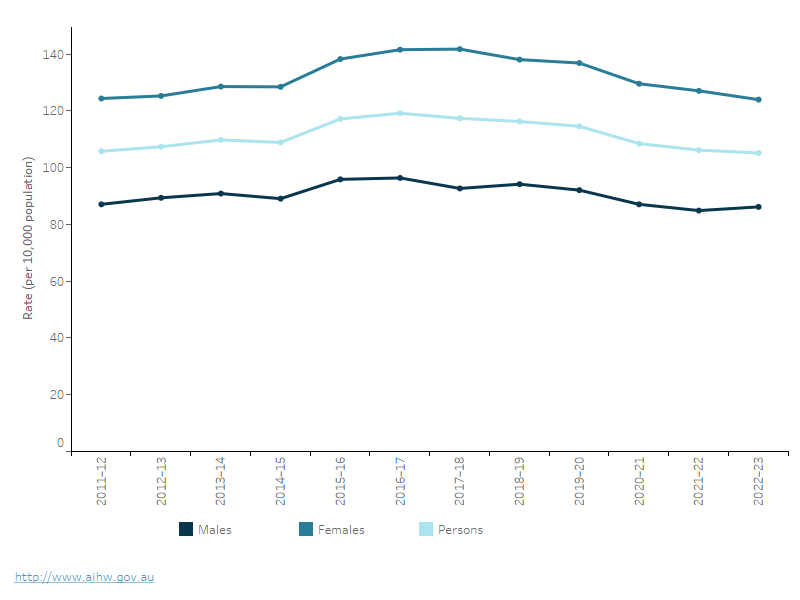
Between 2011–12 and 2022–23, the rate of SHS clients was highest in 2016–17, decreasing in more recent years. The overall rate for female clients decreased from around 124.4 clients per 10,000 population in 2011–12 to 124.0 in 2022–23; the rate of male clients declined from 87.1 in 2011–12 to 86.2 in 2022–23 (Figure 2).