Mental health prescriptions
This section presents information on the Pharmaceutical Benefits Scheme (PBS) information and Repatriation Pharmaceutical Benefits Scheme (RPBS) on prescriptions for mental health-related medications; both subsidised prescriptions and under co-payment prescriptions (that is, prescriptions that cost less than the threshold for subsidy under the PBS). Mental health‑related medications reported in this section comprise the broad groups Antipsychotics, Anxiolytics, Hypnotics and sedatives, Antidepressants, and Psychostimulants, agents used for Attention-deficit hyperactivity disorder (ADHD) and nootropics prescribed by all medical practitioners.
Unless otherwise stated in this report, prescriptions dispensed include total prescriptions, that is, both subsidised and under co-payment arrangements.
The AIHW uses "First Nations people" to refer to Aboriginal and/or Torres Strait Islander people in this report.
For further information on the PBS and RPBS and the medications covered by these schemes, refer to the data source section.
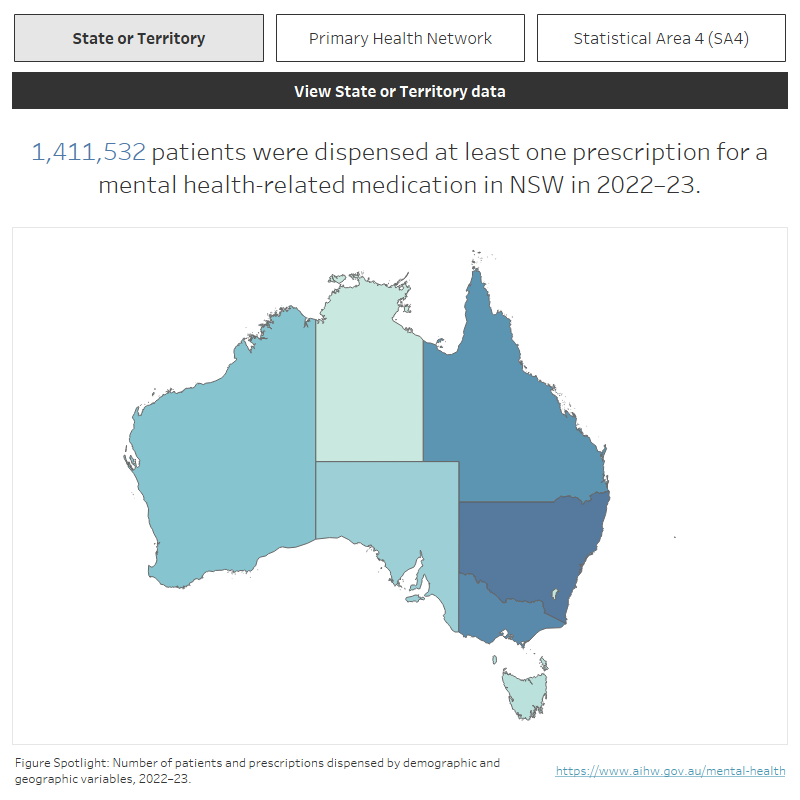
Interactive map and chart showing the number of patients who received a mental health-related prescription and the number of prescriptions dispensed from 2014–15 to 2022–23 across state or territory, Primary Health Network and Statistical Area 4. Refer to csv file in data downloads. In 2022–23, 4,836,605 patients in total received a mental health-related prescription.
Patient characteristics
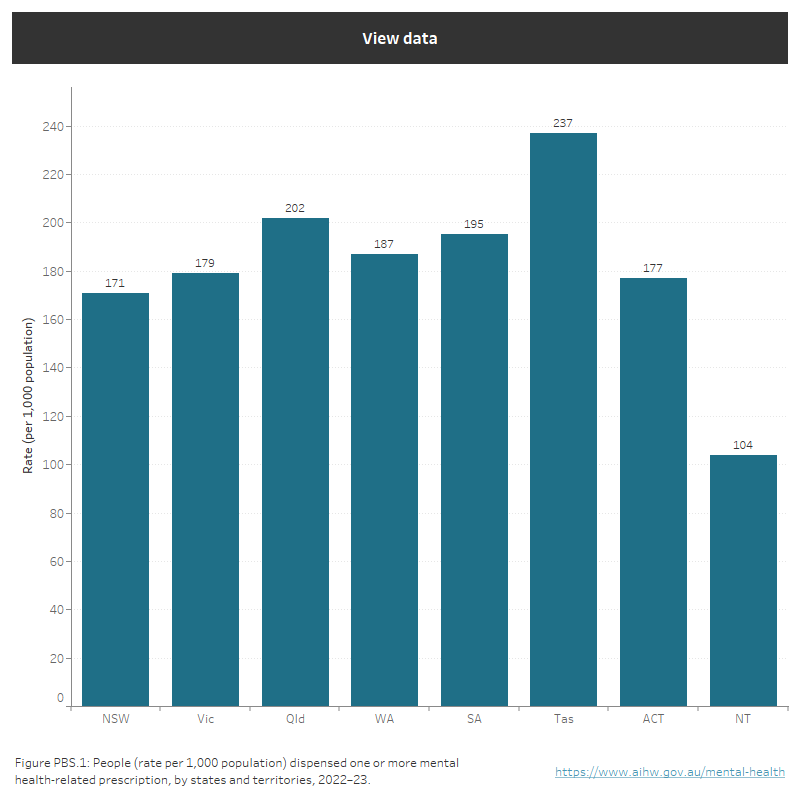
About 18% of the Australian population were dispensed a mental health-related prescription in 2022–23. Tasmania had the highest population rate (237 per 1,000 population), while New South Wales (171) and the Australian Capital Territory (177) had the lowest. The Northern Territory – with the lowest rate of people receiving prescriptions – is not mentioned above since a proportion of the Australian Government subsidy on pharmaceuticals in remote First Nations communities is funded through the Aboriginal Health Services program, where drugs are supplied directly to patients. Therefore, figures presented for jurisdictions with relatively higher First Nations populations e.g. the Northern Territory are considered to be an underestimate (Figure PBS.1).
Figure PBS.1: Rate of people receiving one or more mental health-related prescription, by states and territories in 2022–23
Rate (per 1,000 population) of patients filling mental health-related prescriptions by states and territories in 2022–23. New South Wales had 171 per 1,000 population, Vic (179), Qld (202), WA (187), SA (195), Tas (237), ACT (177), NT (104). Refer to Table PBS.2.
Source: PBS/RPBS data (sourced from Australian Government Department of Health and Aged Care): Table PBS.2.
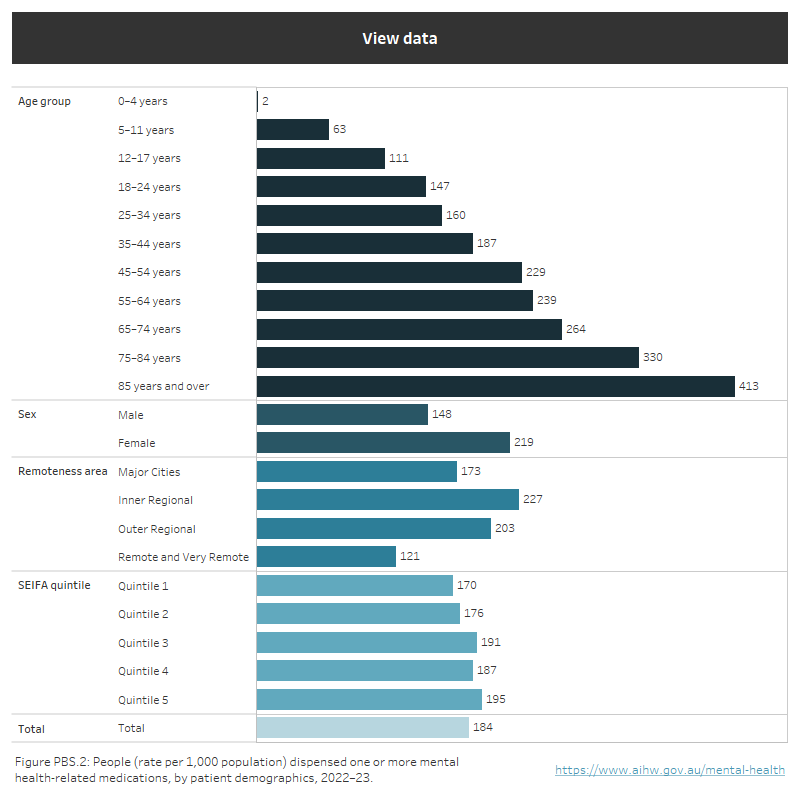
The population rate of people receiving mental health-related prescriptions in 2022–23, was lowest for the youngest age groups and increased by age. A higher rate of females (219 per 1,000 population) were dispensed mental health-related prescriptions than males (148). A greater rate of people living in Inner regional areas were dispensed mental health-related medications (227 per 1,000 population), than people living in other remoteness areas.
Figure PBS.2: Demographic rates of patients who received mental health-related medications in 2022–23
Rate per 1,000 population of people filling mental health-related prescriptions, by patient demographics for 2022–23. Rates were lowest for people aged 0–4 years (2) gradually increasing to 413 for those 85 years and over. The rate of females (219) filling prescriptions was higher than males (148). The rate varied among patient area of usual residence: Major cities (173), Inner regional (227), Outer regional (203), Remote and Very remote (121). Refer to Table PBS. 4 and PBS. 5.
Note: A proportion of the Australian Government subsidy on pharmaceuticals in remote First Nations communities is funded through the Aboriginal Health Services program, where drugs are supplied directly to patients and hence are not included in these data. Therefore, figures presented for sub-jurisdictional areas with relatively higher First Nations populations for example, Remote and Very Remote areas are considered to be an underestimate.
Source: PBS/RPBS data (sourced from Australian Government Department of Health and Aged Care): Table PBS.4 and PBS.5.
The population rate of people dispensed a mental health‑related prescription was predominately higher for females than males, with the highest patient rate for females aged 85 all drug types (464 per 1,000 population). However, males (particularly those aged 5–11) had a higher rate of Psychostimulants, agents used for ADHD and nootropics than females (79 per 1,000 population for males compared to 30 for females).
Female patients were dispensed more Anxiolytics (41 per 1,000 population compared with 26), Hypnotics and sedatives (27 compared with 16), and Antidepressants (176 compared with 103). The rates for Antipsychotics were similar for males and females.
The rate of filling mental health-related prescriptions (subsidised and under co-payment) rose slightly over the past ten years, from 162 per 1,000 population in 2013–14 to 184 in 2022–23. The rate of people filling subsidised prescriptions remained consistent over this time at around 100 per 1,000 population.
Prescriptions by type
Antidepressants (73%, or 33.4 million) was the most commonly dispensed medication in 2022–23, followed by Antipsychotics (10% or 4.3 million), Psychostimulants, agents used for ADHD and nootropics (7% or 3.3 million), Anxiolytics (6% or 2.9 million), and Hypnotics and sedatives (4% or 1.7 million).
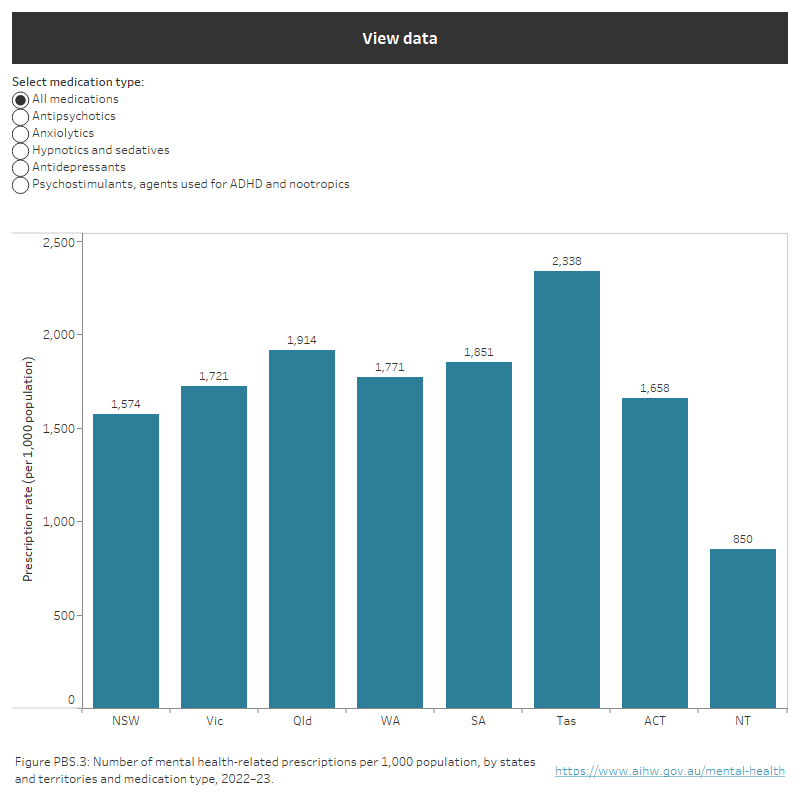
In 2022–23, for all medication types, Tasmania (2,338 per 1,000 population) had the highest while New South Wales (1,574) and the Australian Capital Territory (1,658) had the lowest rate of mental health-related prescriptions dispensed (excluding the Northern Territory – see the Note accompanying Figure PBS.3).
There was some variability in the population rates of dispensed medications by medication type between states and territories.
Figure PBS.3: Prescription rates by medication type and states and territories in 2022–23
Rate of mental health-related prescriptions per 1,000 population by jurisdiction and medication type in 2022–23. Prescription rates for all medications: NSW (1,574), Vic (1,721), Qld (1,914), WA (1,771), SA (1,851), Tas (2,338), ACT (1,658), NT (850). Refer to Table PBS.2.
Note: A proportion of the Australian Government subsidy on pharmaceuticals in remote First Nations communities is funded through the Aboriginal Health Services program, where drugs are supplied directly to patients and hence are not included in these data. Therefore, figures presented for jurisdictions with relatively higher First Nations populations, for example the Northern Territory are considered to be an underestimate.
Source: PBS/RPBS data (sourced from Australian Government Department of Health and Aged Care): Table PBS.2.
The rate of PBS mental health-related prescriptions (1,732 per 1,000 population) was higher than the Medicare Benefits Schedule (MBS) mental health-related services rate (103). The rate of prescriptions dispensed and proportion of patients accessing PBS mental-health prescriptions is generally higher than those accessing MBS mental-health services. This may be since, one MBS service can result in multiple PBS prescriptions dispensed due to repeat prescriptions.
Who prescribes mental-health related prescriptions?
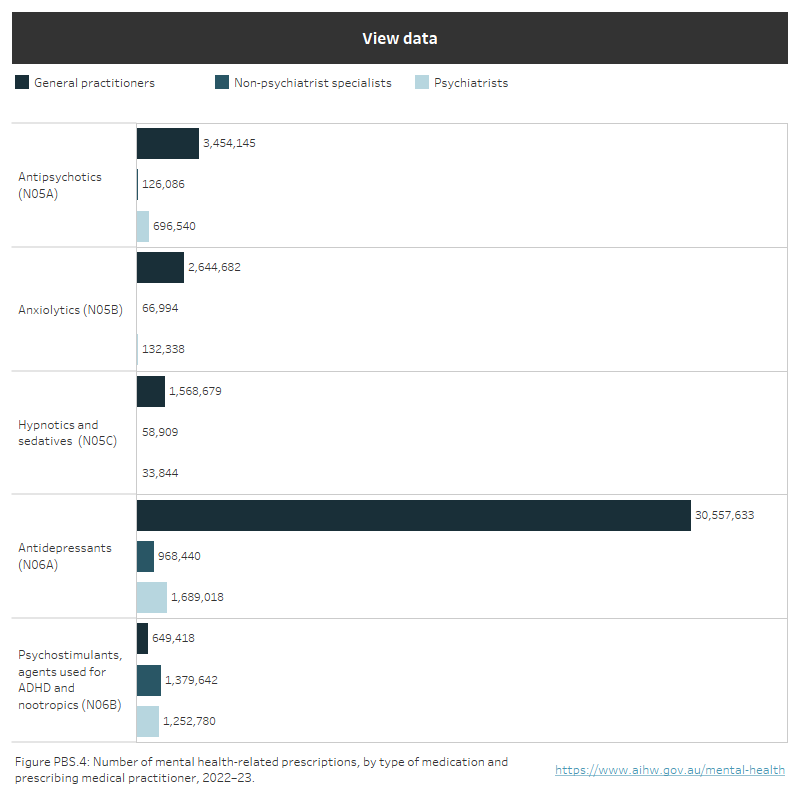
In 2022–23, the majority (85%) of prescriptions were written by general practitioners (GPs), except for Psychostimulants, agents used for ADHD and nootropics where 42% came from non-psychiatrist specialists, 38% came from psychiatrists, and only 20% from GPs. This is likely to be due to the restrictions on which medical practitioners can prescribe psychostimulants under the PBS.
Figure PBS.4: Number of mental health-related prescriptions, by type of medication and prescribing medical practitioner in 2022–23
Number of mental health-related prescriptions dispensed, by ATC group of medication and prescribing medical practitioner, 2022–23. Antidepressants were prescribed by: GPs (31 million), non-psychiatrist specialists (1 million), psychiatrists (1.7). Antipsychotics (3.5, 0.1, 0.7), Anxiolytics (2.6, 0.07, 0.1), Hypnotics and sedatives (1.6, 0.06, 0.03) and Psychostimulants, agents used for ADHD and nootropics (0.6, 1.4, 1.3). Refer to Table PBS.3.
Source: PBS/RPBS data (sourced from Australian Government Department of Health and Aged Care): Table PBS.3.
The highest average number of prescriptions dispensed per patient was for Antidepressants and Antipsychotics (both at 9) in 2022–23. Females had a higher rate of prescriptions dispensed (around 2,083 per 1,000 population) than males (around 1,355) in 2022–23. Males (9) and females (9) were dispensed the same number of scripts per patient.
Has the rate of mental health-related prescriptions changed over time?
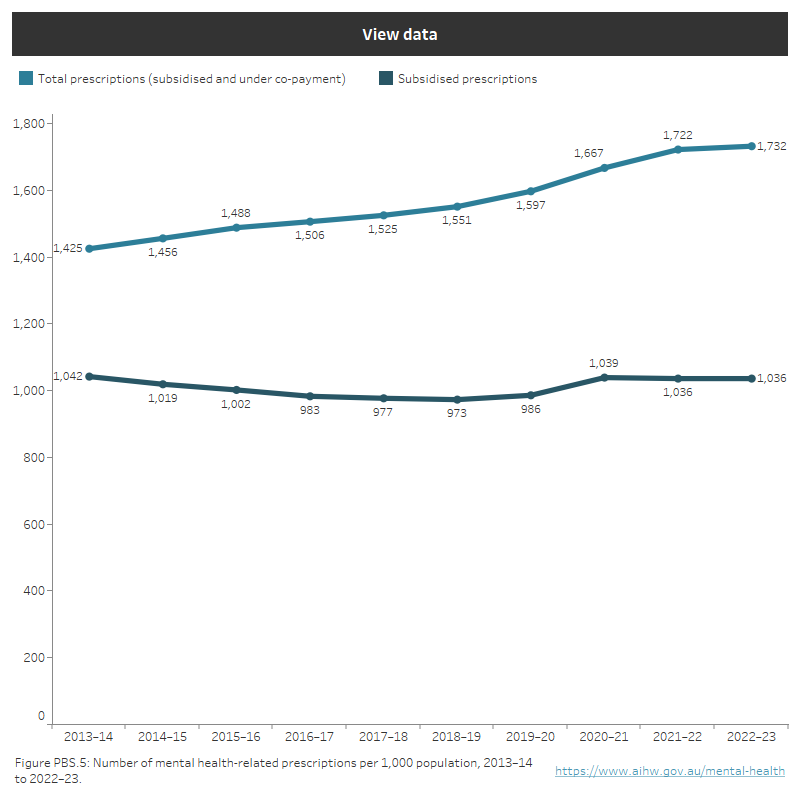
The rate (per 1,000 population) of total mental health-related prescriptions being dispensed increased from 1,551 in 2018–19 to 1,732 in 2022–23. The rate of subsidised prescriptions dispensed also increased over the same period but at a slower rate. This may be due to price reductions on medications no longer under patent and competing brands listed at reduced price (Department of Health and Aged Care 2024) (Figure PBS.5). More information about this is available in Expenditure on mental health-related services.
Figure PBS.5: Number of mental health-related prescriptions per 1,000 population over time
Rate of mental health-related prescriptions per 1,000 population between 2013–14 and 2022–23. Rates of subsidised prescriptions: the lowest rate was 973 in 2018–19 and the highest was 1,042 in 2013–14. Rates for total prescriptions: the lowest rate was 1,425 in 2013–14 and the highest was 1,732 in 2022–23. Refer to Table PBS.11.
Source: PBS/RPBS data (sourced from Australian Government Department of Health): Table PBS.1.
Between 2018–19 and 2022–23, the rate (per 1,000 population) of mental health-related prescriptions dispensed decreased for:
- Anxiolytics (140 to 110)
- Hypnotics and sedatives (87 to 64).
Prescription rates increased over the same period of time for:
- Antidepressants (1,099 to 1,269)
- Psychostimulants, agents used for ADHD and nootropics (59 to 125).
The increase in Psychostimulants, agents used for ADHD and nootropics over the past 5 years may be due to an increased focus on Attention Deficit Hyperactivity Disorder (ADHD) through the media. The increase in awareness regarding ADHD and associated symptoms may have resulted in an increased demand for treatment including prescription of psychostimulants. It is anticipated that rates of prescribing have continued to increase since 2023 (Parliament of Australia 2023).
Regional reporting
Information on mental health-related prescriptions can also be reported at a sub-jurisdictional level, within state and territory boundaries. Refer also to the Spotlight data.
Data for 2022–23 shows variation in the number and rate of prescriptions and patients across Australia’s 31 Primary Health Network (PHN) areas, as well as at the Statistical Area 4 (SA4) regions. For the analysis presented here, geographical area is based on the patient's residential address, or, if the patient’s address is unknown, the location of the supplying pharmacy is used.
The Queensland Wide Bay SA4 region had the highest rate of mental health-related medications dispensed in 2022–23 (2,530 per 1,000 of the population), followed by the New South Wales Mid North Coast (2,503) SA4 region. Northern Territory – Outback (296) and Western Australia – Outback (North) (710) SA4 region had the lowest rate.
Tasmania PHN had the highest rate of mental health-related medications dispensed in 2022–23 (2,315 per 1,000 of the population). The Northern Territory (670) followed by Western Sydney (972) PHNs had the lowest rate.
Note: A proportion of the Australian Government subsidy on pharmaceuticals in remote First Nations communities is funded through the Aboriginal Health Services program, where drugs are supplied directly to patients and hence are not included in these data. Therefore, figures presented for sub-jurisdictional areas with relatively higher First Nations populations e.g. the Northern Territory and Western Australia are considered to be an underestimate.
Where can I find more information?
Pharmaceutical Benefits Scheme and Repatriation Pharmaceutical Benefits Scheme data
The Australian Government subsidises the cost of prescription medicines through 2 schemes, the Pharmaceutical Benefits Scheme (PBS) and the Repatriation Pharmaceutical Benefits Scheme (RPBS) for eligible veterans and their dependants.
People fall into 2 broad classes: general and concessional. Concessional beneficiaries include pensioners, Health Care card holders, Commonwealth Seniors Health card holders and Veterans card holders. Under the PBS/RPBS, the patient is required to contribute a co-payment which is indexed annually; $31.60 for general patients and $7.70 for those with a concession card as of 1 January 2024. If a medicine is priced below the relevant co-payment threshold the consumer pays the full price and the prescription is classified as ‘under co-payment’. If a medicine is not listed in the PBS Schedule of Pharmaceutical Benefits, the consumer pays the full price as a private prescription, and the data is not included in the presented tables.
The collection of under co-payment prescription data for the PBS and RPBS commenced on 1 April 2012. The data collected is identical to that collected for subsidised prescriptions. Prior to 2012 the only source of under co-payment data was a survey of pharmacies funded by the Australian Government Department of Health and Aged Care (the Department) (refer to the information on the Drug Utilisation Sub-Committee (DUSC) below). Time series presentation of survey data with the under-co-payment data is not possible prior to 2012–13 as the DUSC data may have been an underestimate of prescription volumes.
Most prescriptions for General Schedule medicines (Section 85) are dispensed through community pharmacies, but PBS is also available in private hospitals and through eligible public hospitals to patients on discharge and day patients. In addition, a number of drugs are distributed under alternative arrangements where these are considered more appropriate (Section 100). Examples are the Highly Specialised Drugs program and General Schedule medicines that are supplied directly to First Nations patients via Aboriginal Health Services program in remote areas of Australia (AHS program). Causing the Northern Territory’s PBS/RPBS statistics to be recognised as an underestimate.
PBS/RPBS does not include the following:
- Private prescriptions
- Over the counter medicines
- Medicines supplied to public hospital inpatients.
Services Australia processes all prescriptions dispensed under the PBS/RPBS and provides these data to the Department of Health and Aged Care. The PBS/RPBS data maintained by the Department has been used to produce this report. Information collected includes the characteristics of the person who is provided with the prescription, the medication prescribed (for example, type and cost), the prescribing practitioner and the supplying pharmacy (for example, location). The figures reported relate to the number of mental health-related prescriptions supplied by pharmacies and processed by Services Australia in the reporting period, the number of people provided with the prescriptions and their characteristics, as well as the prescription costs funded by the PBS and RPBS (further information can be found in the Expenditure section).
From February 2020, a range of restrictions on travel, business, social interaction and border controls were introduced to prevent and reduce the spread of SARS-CoV-2, the virus that causes COVID-19 disease. While this report explores the impact on mental health‑related prescriptions, the AIHW has published a report on the Impacts of COVID‑19 on Medicare Benefits Scheme and Pharmaceutical Benefits Scheme service use more broadly.
Although the PBS and RPBS data capture most of the prescribed medicines dispensed in Australia, these data have the following limitations:
- The number of patients dispensed under co-payment prescriptions cannot be derived by subtracting the number of patients receiving subsidised prescriptions from the total number of patients shown in the tables. Patients may receive both subsidised and under co-payment prescriptions.
- Programs funded by the PBS/RPBS that do not use the Services Australia online processing system include:
- Public hospitals
- Aboriginal Health Services program
- Opiate Dependence Treatment Program.
Only one of these has a bearing on the mental health-related prescriptions data published in the Prescriptions and Expenditure sections: the Aboriginal Health Services program. Most affected are the data for Remote and Very remote areas and the data for the Northern Territory. Consequently, the mental health-related prescriptions data in these sections will not fully reflect Australian Government expenditure on mental health-related medications.
- All data is presented by the date of supply, that is, when the prescription was dispensed to the patient. For demographic tables, patient characteristics are determined at a single point in each year, ensuring each person is only counted once in the year.
- State and territory are determined according to the patient’s residential address as recorded on the Medicare Enrolment file. If the patient’s state or territory is unknown, then the state or territory of the pharmacy supplying the item is reported.
The Anatomical Therapeutic Chemical (ATC) classification version used is the primary classification as it appears in the PBS Schedule of Pharmaceutical Benefits. This can differ slightly from the World Health Organization (WHO) version (WHO 2022). There are 3 differences between the WHO ATC classification and the PBS Schedule classification that have a bearing on mental health data:
- Prochlorperazine is regarded as an antiemetic (A04A) in the PBS Schedule while it is an antipsychotic (N05A) according to the WHO classification. This means that information on prochlorperazine will not appear in the data provided as it is not listed as a mental health drug in the PBS Schedule.
- Bupropion is listed as an anti-smoking drug (N07B) in the PBS Schedule while it is an antidepressant (N06A) according to the WHO classification. This means that bupropion will not appear in the data as it is not listed as a mental health drug in the PBS schedule.
- Lithium carbonate is classified as an antidepressant (N06A) in the PBS Schedule while it is an antipsychotic (N05A) according to the WHO classification. This means that lithium carbonate will appear in the data as an antidepressant rather than an antipsychotic.
Clozapine (N05A) historical data incomplete
Clozapine is PBS listed under the Highly Specialised Drugs (HSD) program, and prior to 2015 was only available through public and private hospital pharmacies. Due to differing HSD funding arrangements over time, historical prescription/patient data is incomplete:
Public hospitals
Prior to 1 July 2010 – no data available.
1 July 2010 to 31 December 2013 - partial data available - gradual transition to prescription-based payments increasing over time, transition complete by December 2013.
1 January 2014 onwards – complete data available.
Private hospitals
Complete data available.
Drug Utilisation Sub-Committee (DUSC) database
Previously mental health-related prescription data products published by the AIHW included data sourced from the DUSC database. From 1 April 2012, following the implementation of the under co-payment data collection, the DUSC-sponsored Pharmacy Guild survey ceased to be the source of under co-payment prescription data. As a result, time series data prior to 2012–13 for under co-payment data has been removed from the tables as the previous survey methodology may be an underestimate of the volumes of under co-payment prescriptions.
Department of Health and Aged Care (2024) About the PBS, Department of Health and Aged Care, Australian Government, accessed 25 March 2024.
Parliament of Australia (2023) Assessment and support services for people with ADHD, Community Affairs References Committee, Australian Government, accessed 7 February 2024.
WHO (World Health Organisation) (2022) ATC: Structure and principles, Oslo: WHO Collaborating Centre for Drug Statistics Methodology, accessed 6 February 2023.
This section was last updated in April 2024.


