Characteristics of young people under supervision
This population pyramid shows that there were more males under supervision than females. The age distribution of males and females was broadly similar, however males under supervision were slightly older on average than females.
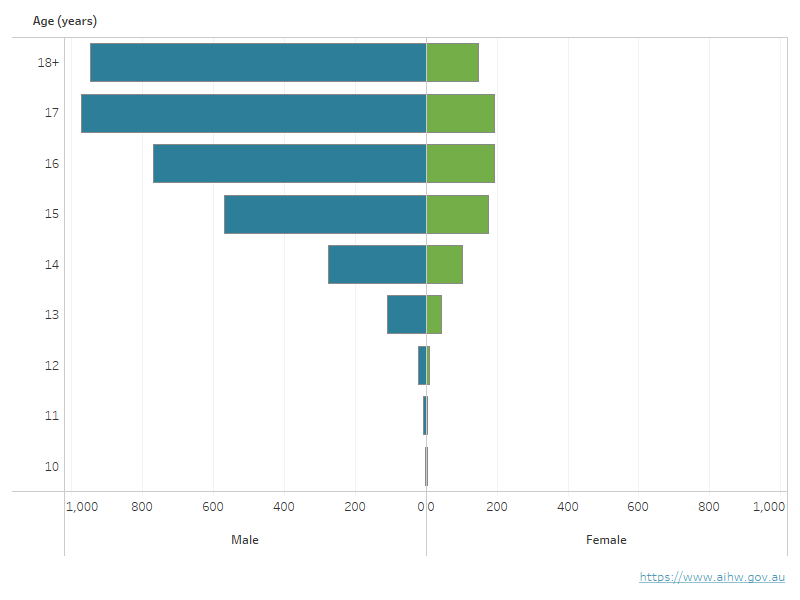
Note: Age on an average day is calculated based on the age a young person is each day that they are under supervision. If the age of a young person changes during a period of supervision, the average daily number under supervision will reflect this. Average daily data broken down by age will not be comparable with data in Youth justice in Australia releases before 2019–20.
Source: Table S5a.
The age profiles of young people under supervision varied among the states and territories. Western Australia had the largest proportion of young people aged 10–13 under supervision on an average day (8.4%), followed by the Northern Territory (6.5%) (Table S7a).
In Victoria, some young people aged 18–20 may be sentenced to detention in a youth facility (known as the ‘dual track’ system), which results in a comparatively older population, on average (49% aged 18 and over and 1.0% aged 10–13) (Table S7a).
A greater proportion of males were in the older age groups (aged 18 and over) than females (Figure 3.1). In 2022–23, about 26% of males under supervision were aged 18 and over, compared with 17% of females (Table S5a).
First Nations young people under supervision
First Nations people have a long history of over-representation in the youth and adult justice systems in Australia (House of Representatives Standing Committee on Aboriginal and Torres Strait Islander Affairs 2011; Johnston 1991). It is important to understand how the past shapes the lives of First Nations Australians today: they have a long history of trauma, cultural dispossession, and forced displacement and assimilation, which affects their physical, mental and social wellbeing.
Disconnection from family and kinship systems, from Country, from spirituality and cultural practices, as well as the loss of parenting practices, are sources of trauma that can be passed from caregiver to child. First Nations Australians’ experience of child welfare policies has historically been traumatic, with the policy of forcible removal of children leading to what is now known as the Stolen Generations.
These removal policies have long-term consequences, including enduring social, physical and psychological impacts for those directly involved and their families and communities. The over-representation of First Nations children in juvenile justice systems reflects this history of trauma and the stressors that have affected their parents, families and communities.
The vast majority of First Nations young people have never been under supervision. About 5.7% of young people aged 10–17 in Australia identified as being of Aboriginal or Torres Strait Islander origin. More than half (1,961, or 57%) of the young people aged 10–17 under supervision on an average day in 2022–23 were First Nations Australians (tables S143 and S3a). This means that 1.3% of First Nations young people were under supervision in 2022–23.
About half (55%) of those aged 10–17 under community-based supervision were First Nations Australians, while 3 in 5 (63%) of those aged 10–17 in detention were First Nations Australians (tables S36a and S74a).
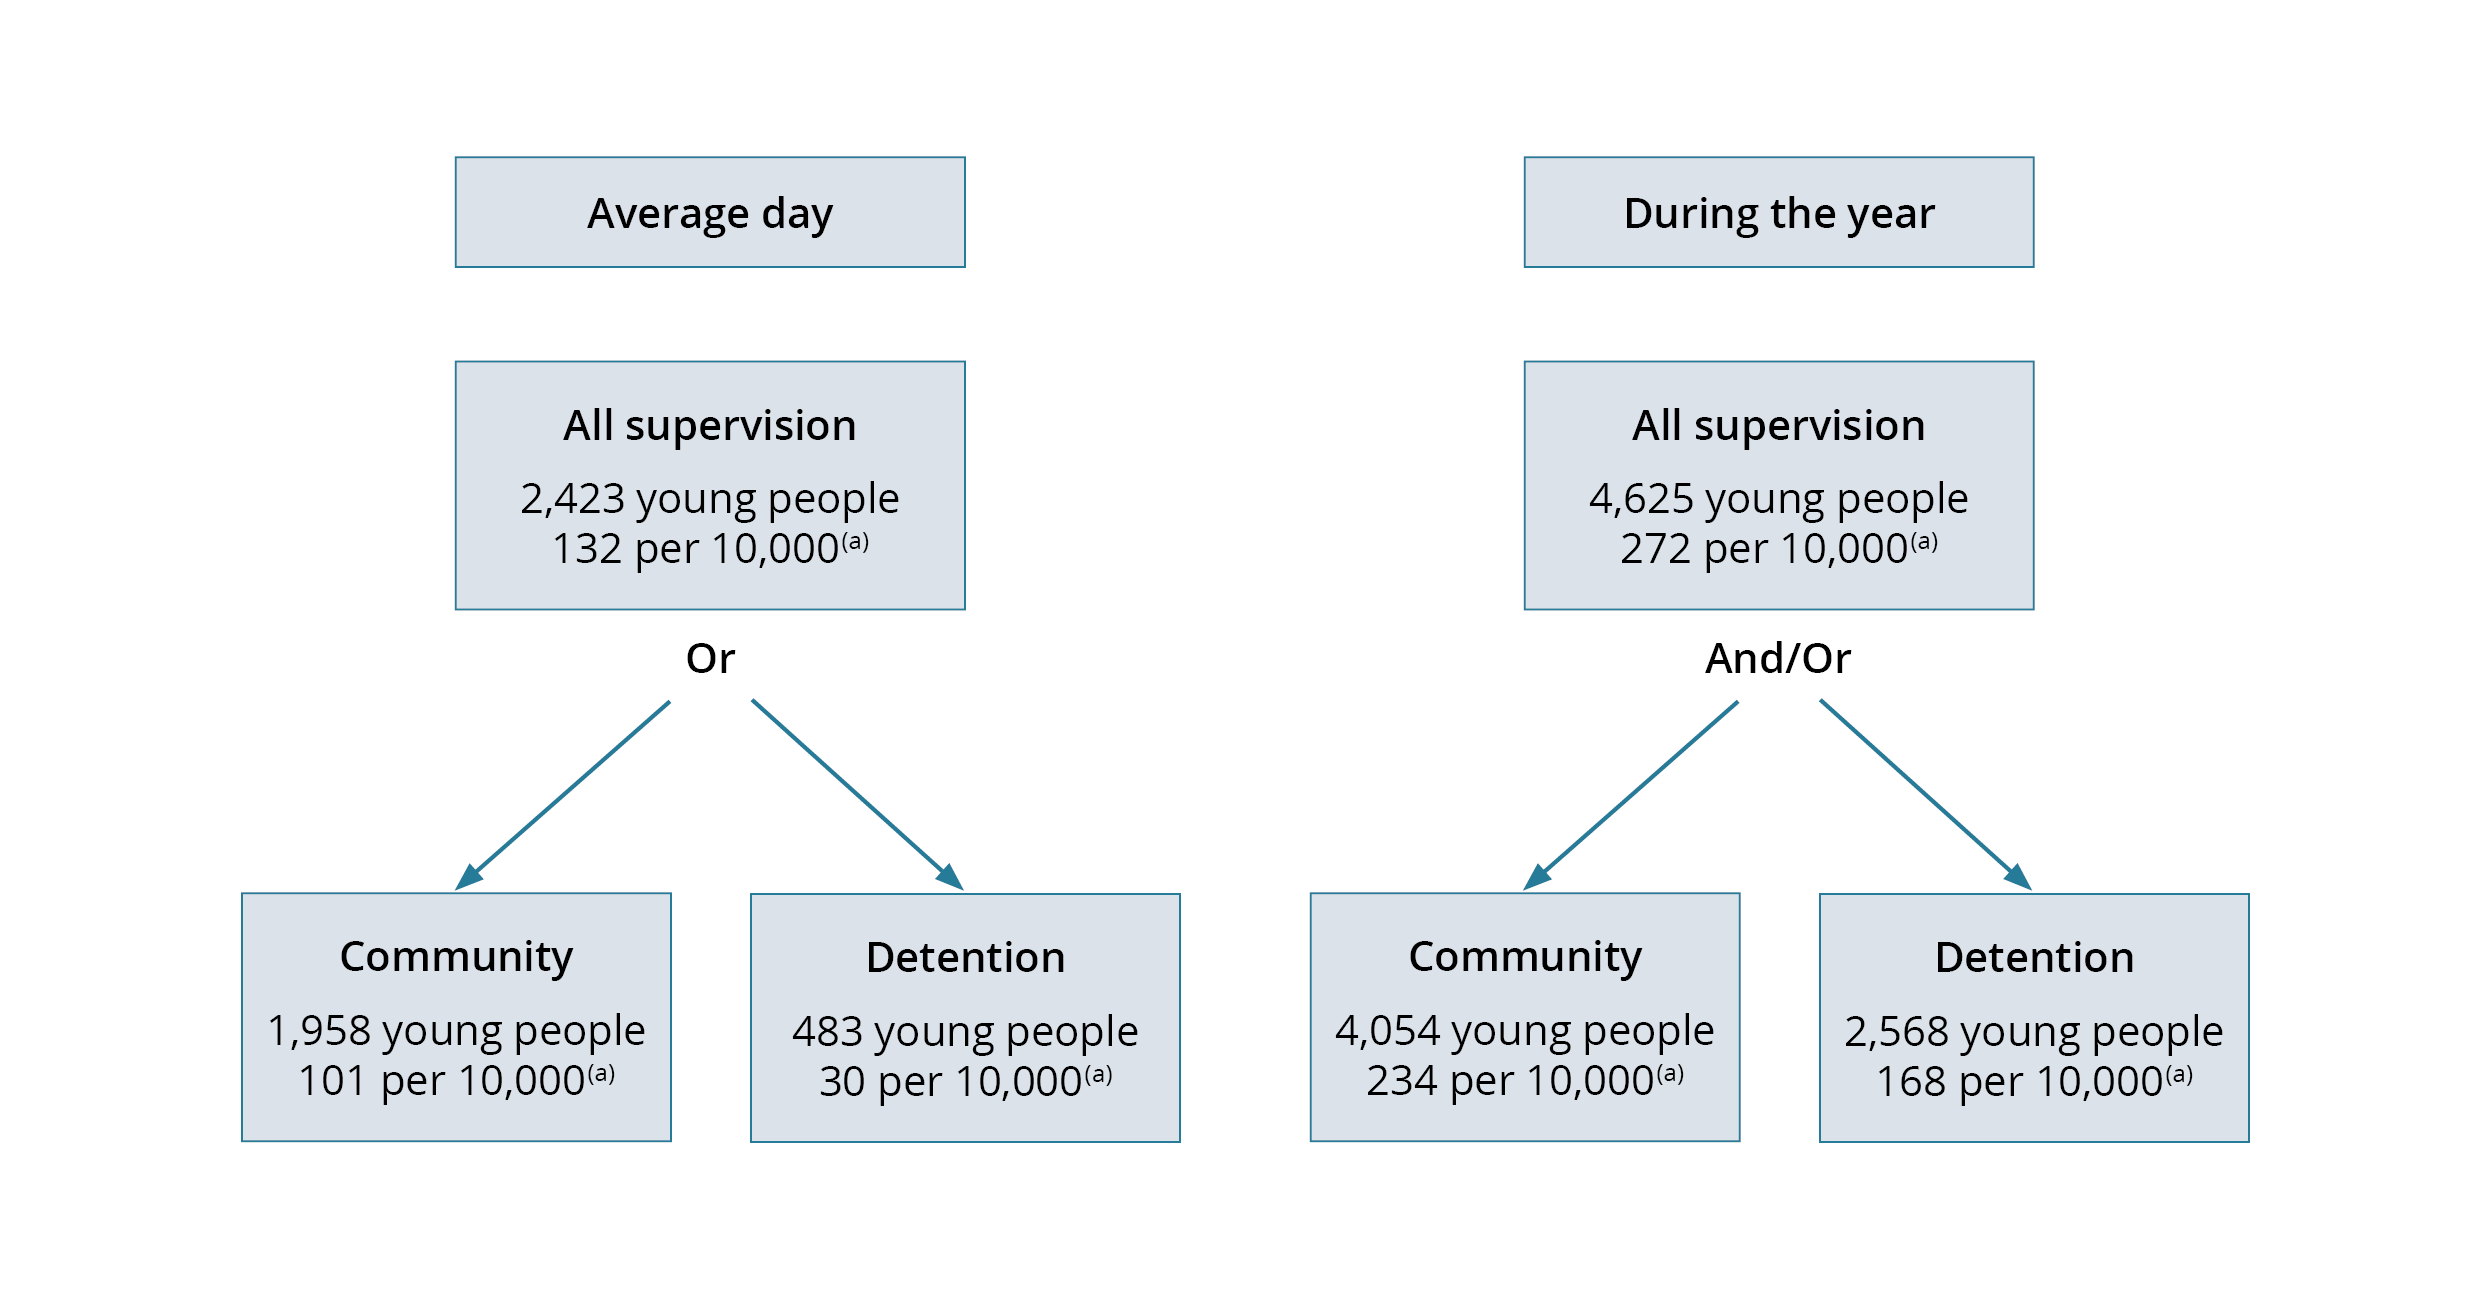
Of young First Nations people who were 10 and over, 2,423 were under youth justice supervision in Australia and 4,625 were supervised at some time during the year (Figure 3.2).
On an average day, most First Nations young people aged 10 and over who were under supervision were supervised in the community (81%); the remainder (20%) were in detention (Figure 3.2). (Proportions may not sum to 100% as some young people are supervised under community-based supervision and detention on the same day.)
Although relatively few First Nations young people were in detention on an average day, about half (56%, or 2,568) of all young people who were supervised during 2022–23 had been in detention at some time during the year (Figure 2.1).
Figure 3.2: First Nations young people under supervision on an average day and during the year, by supervision type, 2022–23 (number and rate)
 Rates are presented for young people aged 10–17.
Notes
- The average daily number of all supervision will not equal the sum of community-based supervision and detention because young people can be in both types of supervision on the same day.
- Young people can be in both community-based supervision and detention during the year so the sum of these types of supervision will not be equal to the total number of young people under youth justice supervision.
Sources: tables S2a, S2b, S4a, S4b, S35a, S35b, S37a, S37b, S73a, S73b, S75a and S75b
In 2022–23, the rate of First Nations young people aged 10–17 under supervision on an average day was 132 per 10,000, compared with 5.8 per 10,000 for non-Indigenous young people (Table 3.1). This means First Nations young people aged 10–17 were about 23 times as likely as their non-Indigenous counterparts to be under supervision on an average day.
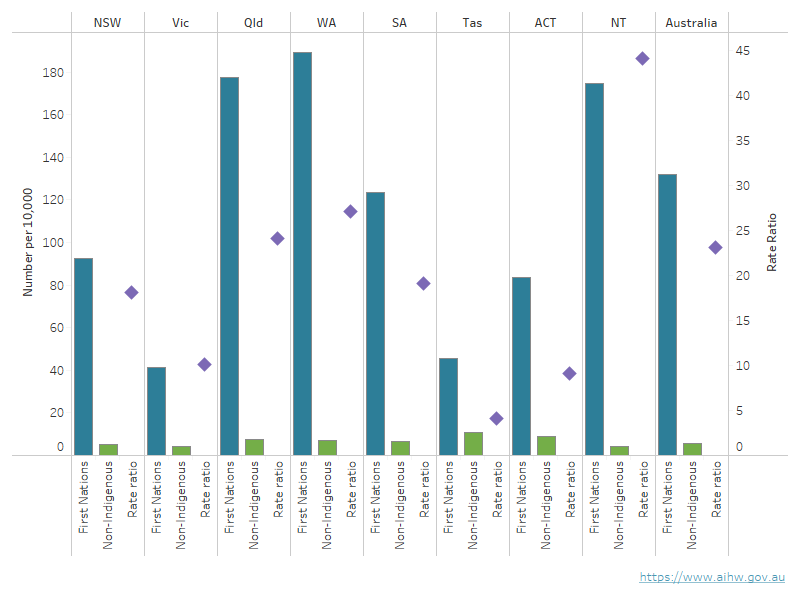
First Nations young people were over-represented under youth justice supervision in every state and territory (Figure 3.2).
The rate of First Nations young people aged 10–17 under supervision on an average day was lowest in Victoria (41 per 10,000) and highest in Western Australia (189 per 10,000). The level of First Nations over-representation under youth justice supervision, as measured by the rate ratio, was lowest in Tasmania (4 times as likely) and highest in the Northern Territory (about 44 times as likely) (Table 3.1; Figure 3.3).
NSW | Vic | Qld | WA | SA | Tas | ACT | NT | Australia | |
|---|---|---|---|---|---|---|---|---|---|
| Community-based supervision rate (per 10,000) | |||||||||
First Nations | 73.5 | 32.9 | 133.2 | 156.3 | 106.6 | 38.5 | 49.5 | 134.0 | 103.2 |
Non-Indigenous | 4.3 | 3.2 | 5.8 | 6.2 | 6.0 | 9.1 | 6.8 | 3.0 | 4.8 |
All young people | 9.1 | 3.7 | 15.8 | 15.7 | 10.9 | 12.4 | 8.2 | 61.2 | 10.6 |
Rate ratio | 17.0 | 10.4 | 22.8 | 25.1 | 17.9 | 4.3 | 7.3 | 44.7 | 21.5 |
| Detention rate (per 10,000) | |||||||||
First Nations | 19.5 | 9.1 | 46.0 | 34.6 | 18.8 | 7.3 | 34.6 | 42.9 | 29.8 |
Non-Indigenous | 0.8 | 1.0 | 1.6 | 0.9 | 0.6 | 1.9 | 2.4 | 1.0 | 1.1 |
All young people | 2.0 | 1.1 | 5.0 | 3.0 | 1.5 | 2.4 | 3.4 | 19.2 | 2.7 |
Rate ratio | 24.1 | 9.3 | 28.8 | 39.7 | 31.4 | 3.9 | 14.2 | 42.6 | 28.0 |
| All supervision rate (per 10,000) | |||||||||
First Nations | 92.4 | 41.5 | 177.6 | 189.2 | 123.7 | 45.6 | 83.6 | 174.7 | 131.9 |
Non-Indigenous | 5.1 | 4.1 | 7.4 | 7.0 | 6.5 | 10.9 | 9.1 | 4.0 | 5.8 |
All young people | 11.0 | 4.7 | 20.7 | 18.6 | 12.2 | 14.7 | 11.5 | 79.5 | 13.3 |
Rate ratio | 18.1 | 10.1 | 24.0 | 26.9 | 19.0 | 4.2 | 9.1 | 43.8 | 22.7 |
Notes
- Rates are not published where there were fewer than 5 young people.
- First Nations rates for South Australia, Tasmania and the Australian Capital Territory should be interpreted with caution due to First Nations population denominators that are less than 10,000.
- The rate ratio is calculated by dividing the First Nations rate by the non-Indigenous rate.
- The rate ratio has been calculated using rates to 3 decimal places.
- Age on an average day is calculated based on the age a young person is each day that they are under supervision. If the age of a young person changes during a period of supervision, the average daily number under supervision will reflect this. Average daily data broken down by age will not be comparable with data in Youth justice in Australia releases before 2019–20.
Sources: tables S4a, S37a and S75a.
Figure 3.3: Young people aged 10–17 under supervision on an average day, by Indigenous status and state and territory 2022–23
This vertical bar chart shows that across all states and territories the rate of First Nations young people under supervision were as higher than the non-Indigenous rate. Western Australia had the highest rate of First Nations young people under supervision (189 per 10,000), while Victoria had the lowest (41 per 10,000).
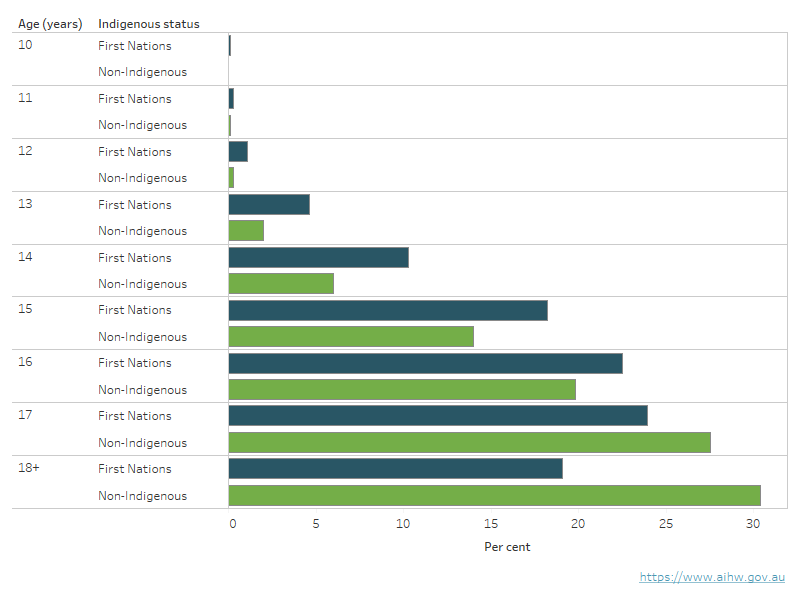
This horizontal bar chart shows that First Nations young people under supervision were younger on average than non-Indigenous young people. First Nations young people were most commonly aged 17 when under supervision, compared with 18 and over for non-Indigenous young people.
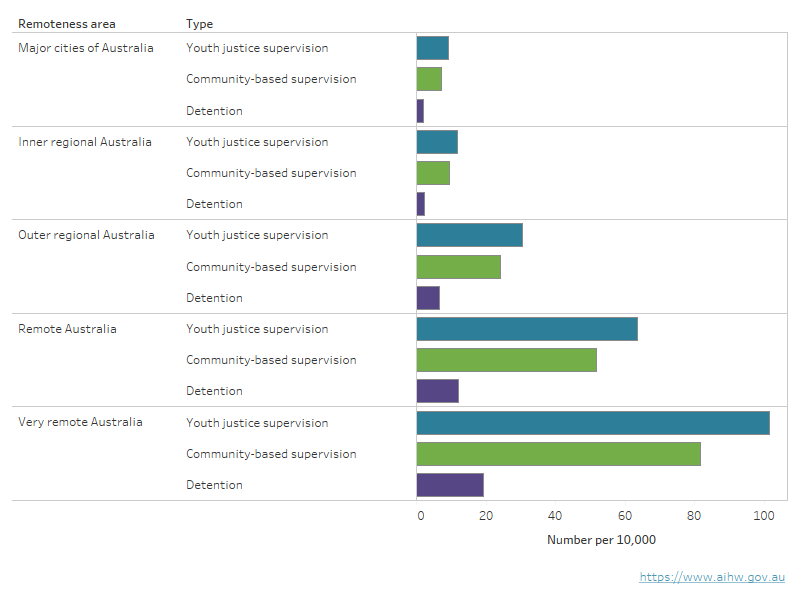
This horizontal bar chart shows that the rate of young people under youth justice supervision generally increased with remoteness. Those who were classified as living in ‘remote’ and ‘very remote’ areas had the highest rates of any youth justice supervision and those living in ‘major cities’ had the lowest rates of any youth justice supervision.
This horizontal bar chart shows that the rate of young people living in the lowest socioeconomic areas were more likely to be in community based supervision and detention than young people living in higher socioeconomic areas. The rate of young people under youth justice supervision declined as the level of socioeconomic advantage increased.
