Rural and remote health
Web article
Last updated:
Topic: Rural & remote Australians
Citation
AIHW
Australian Institute of Health and Welfare (2024) Rural and remote health, AIHW, Australian Government, accessed 03 May 2024.
APA
Australian Institute of Health and Welfare. (2024). Rural and remote health. Retrieved from https://www.aihw.gov.au/reports/rural-remote-australians/rural-and-remote-health
MLA
Rural and remote health. Australian Institute of Health and Welfare, 30 April 2024, https://www.aihw.gov.au/reports/rural-remote-australians/rural-and-remote-health
Vancouver
Australian Institute of Health and Welfare. Rural and remote health [Internet]. Canberra: Australian Institute of Health and Welfare, 2024 [cited 2024 May. 3]. Available from: https://www.aihw.gov.au/reports/rural-remote-australians/rural-and-remote-health
Harvard
Australian Institute of Health and Welfare (AIHW) 2024, Rural and remote health, viewed 3 May 2024, https://www.aihw.gov.au/reports/rural-remote-australians/rural-and-remote-health
This graph shows the age and sex for each of the remoteness areas by age groups 0-4, 5–14, 15–24, 25–34, 35–44, 45–54, 55–64, 65–74, 75–84 and 85+. The graph shows that on average, people living in Remote and very remote areas are younger than those in Major cities. The highest proportion of older Australians aged 65+ live in Inner regional and Outer regional areas.

This line chart shows the proportion of people aged 20–64 with a Bachelor’s degree or higher qualification or Year 12 equivalent qualification, by remoteness area. There was a higher proportion of people aged 20–64 living in Major Cities who have a Bachelor’s degree or higher qualification or Year 12 equivalent qualification compared with people living in Regional and Remote areas.

This chart shows the prevalence of health risk factors including, current daily smoking, excessive alcohol consumption, inadequate fruit intake, inadequate vegetable intake, insufficient physical activity, overweight and obesity and high blood pressure by remoteness area. For most risk factors, prevalence was similar across all remoteness areas, except current daily smoking and excessive alcohol consumption which was higher outside of Major cities.

This chart shows the prevalence of chronic conditions including arthritis, asthma, back pain and problems, chronic obstructive pulmonary disease, diabetes, heart, stroke and vascular disease, mental and behavioural problems and osteoporosis by remoteness area. The prevalence of most chronic conditions was similar across remoteness areas but rates of arthritis and mental and behavioural conditions were higher outside of Major cities.

Notes:
- Proportions were age standardised to the 2001 Australian Standard Population.
- Excludes Very remote areas.
- Data are self-reported. For more information, see National Health Survey Methodology (ABS 2023f).
Source: AIHW analysis of ABS 2023e; Table S4.
Cancer
The age-standardised incidence rate of all cancers combined was highest in Inner regional and Outer regional areas in 2012–2016 (513 and 512 per 100,000 people, respectively), slightly lower in Major cities and Remote areas (both 487 cases per 100,000 people), and lowest in Very remote areas (422 cases per 100,000 people) (AIHW 2021b).
However, the incidence rate for all cancers combined for Very remote areas may be influenced by lower population screening participation rates, later detection of cancer and lower life expectancy due to death from other causes (AIHW 2021b; Fox and Boyce 2014). Very remote areas had the highest incidence rate for cervical cancer, liver cancer, cancer of unknown primary site, uterine cancer and head and neck cancers (including lip).
In the period 2012–2016, people living in Major cities had the highest 5-year observed survival for all cancers combined (63%) compared with 61% for all other areas, except for Very remote areas which had the lowest survival rate (55%) (AIHW 2021b).
For more information, see Cancer in Australia 2021 and Cancer.
Burden of disease
Burden of disease refers to the quantified impact of a disease or injury on a population, which captures overall health loss, that is, years of healthy life lost through premature death or living with ill health.
In 2018, after adjusting for age, the total burden of disease and injury in Australia increased with increasing remoteness (AIHW 2021a). The total burden was lowest in Major cities (174 DALY per 1000 population) rising to 200 and 204 for Inner and Outer regional areas, respectively, and 244 DALY per 1000 population in Remote and very remote areas. This pattern was mostly driven by fatal burden (years of life lost due to premature death).
Figure 5 shows that for some chronic conditions, the burden of disease increased with increasing remoteness, such as coronary heart disease, type 2 diabetes, chronic kidney disease, lung conditions and suicide and self-inflicted injuries. The burden of disease decreased with increasing remoteness for anxiety, back pain and dementia (Table S5; AIHW 2021a).
For more information, see Burden of disease.
Figure 5: Health burden for major diseases and injuries, by remoteness area, 2018
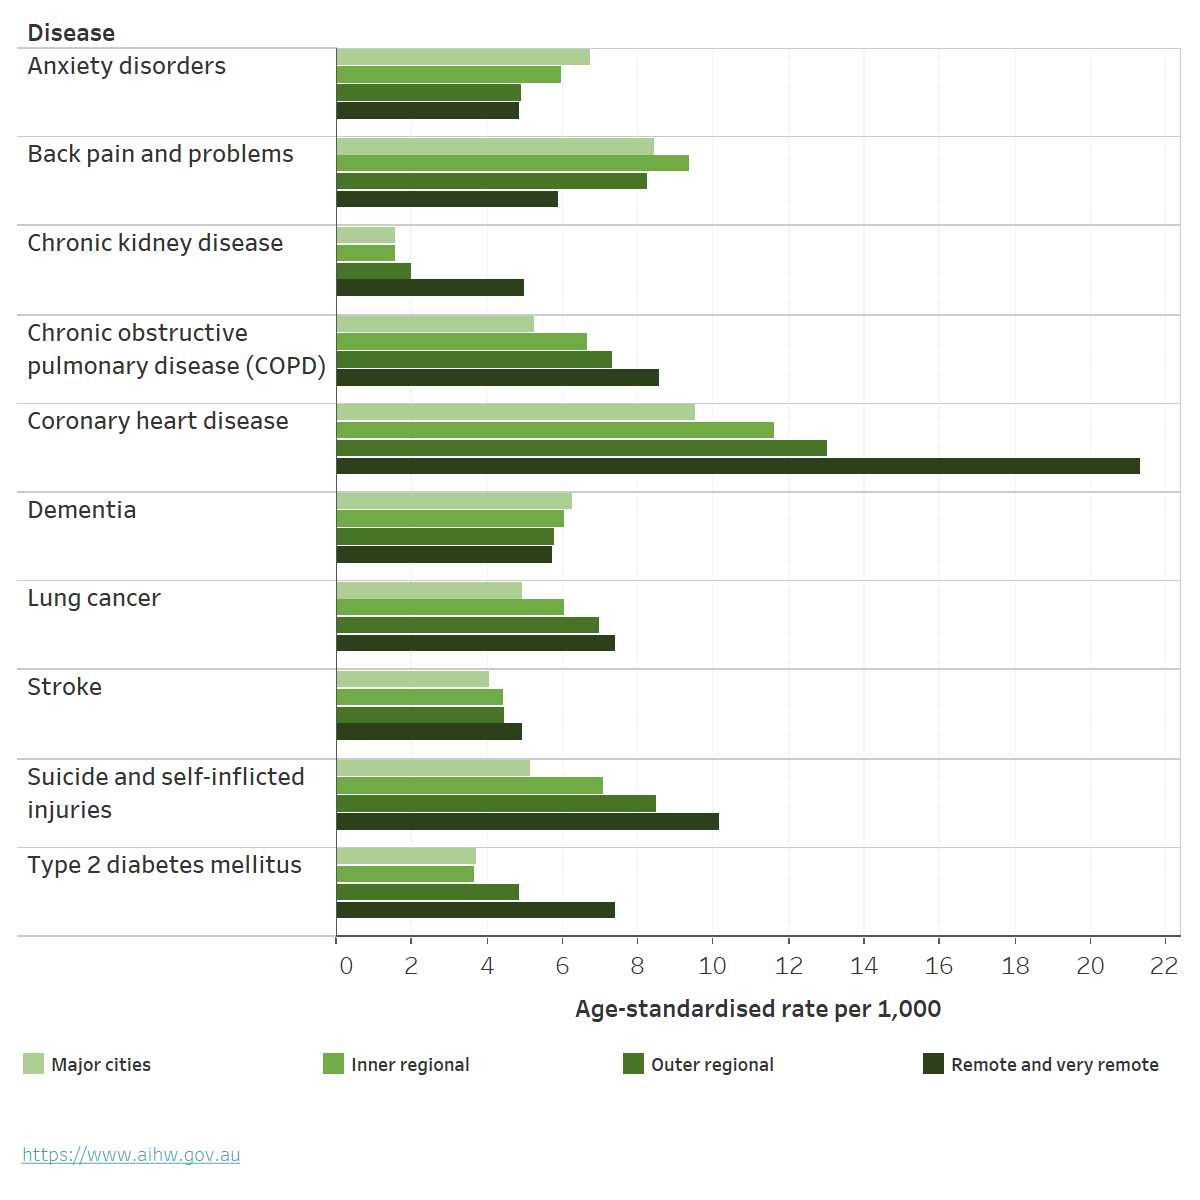
Chart: AIHW. Source: AIHW 2021a; Table S5.
Deaths
People living in rural and remote areas are more likely to die at a younger age than their counterparts in Major cities. They have higher mortality rates and higher rates of potentially avoidable deaths than those living in Major cities.
In 2021, age-standardised mortality rates increased as remoteness increased for males and females (Table 1; AIHW 2023h). Compared with all of Australia:
- People living in Inner or Outer regional areas had a mortality rate 1.1 times as high.
- People living in Remote areas had a mortality rate 1.2 times as high.
- People living in Very remote areas had a mortality rate 1.5 times as high.
- Males had a higher mortality rate than females in all remoteness areas.
For more information, see Deaths in Australia.
| Major cities | Inner regional | Outer regional | Remote | Very remote | |
|---|---|---|---|---|---|
| Median age at death (Males) | 80 | 79 | 77 | 73 | 67 |
| Age-standardised rate (deaths per 100,00) (Males) | 569 | 636 | 675 | 711 | 925 |
| Rate ratio (Males) | 0.95 | 1.06 | 1.13 | 1.19 | 1.55 |
| Median age at death (Females) | 85 | 84 | 83 | 79 | 69 |
| Age-standardised rate (deaths per 100,00) (Females) | 409 | 456 | 477 | 514 | 644 |
| Rate ratio (Females) | 0.96 | 1.07 | 1.12 | 1.20 | 1.51 |
Note: Rate ratios are calculated as the age-standardised rate for the geographic area of interest divided by the age-standardised rate for the reference group (all of Australia).
Source: AIHW 2023h.
Leading causes of death
Between 2017–2021, when comparing mortality rates for Australia overall, the leading causes of death varied by remoteness area (Figure 6; AIHW 2023h).
- Coronary heart disease was the leading cause of death across all remoteness areas. Age-standardised rates were between 1.1 and 1.7 times higher outside of Major cities than for Australia overall.
- The top 7 causes of death were the same for Major cities, Inner regional and Outer regional areas.
- Land transport accidents were a leading cause of death in Remote and Very remote areas. The rate of dying due to land transport accidents was nearly 3 times as high for Remote areas and nearly 4 times as high for Very remote areas, compared with Australia overall (AIHW 2023h).
Figure 6: Leading cause of death by remoteness area, with comparison of mortality rates to Australia overall, 2017–2021
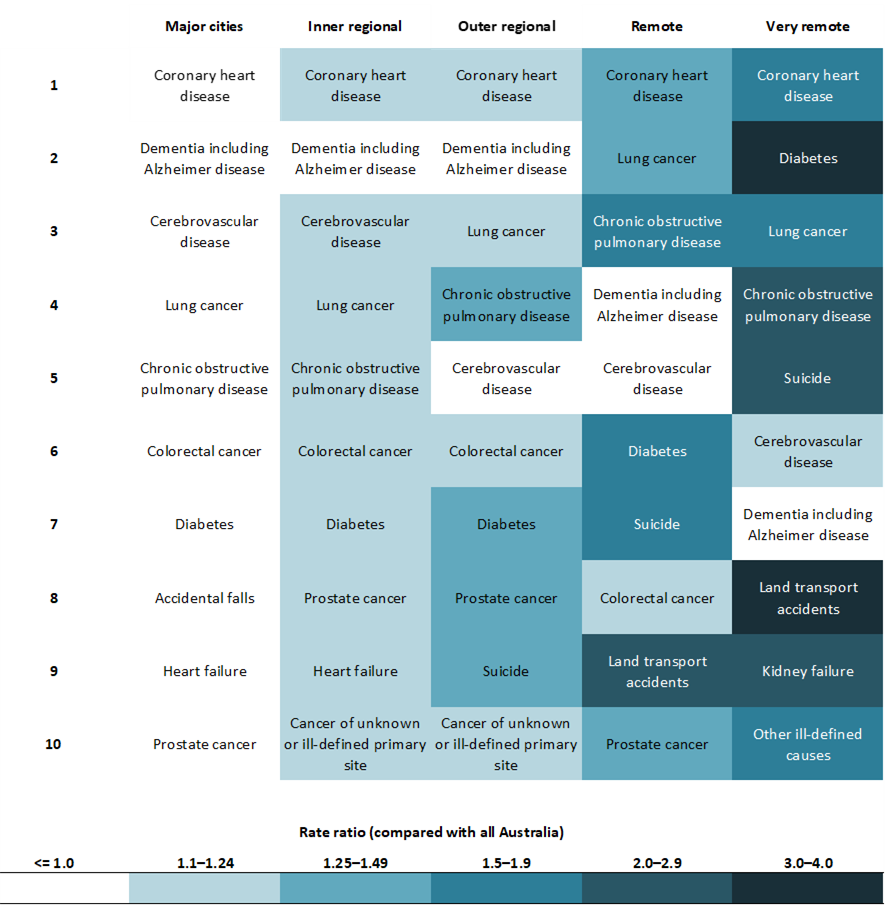
Notes
- Rates are age-standardised to the 2001 Australian standard population.
- Leading causes of death are listed in order of number of deaths in each remoteness area from 2017–2021.
- Boxes are coloured based on rate ratio comparing each region to Australia overall.
Source: AIHW 2023h; Table S4.
Potentially avoidable deaths
The rate of potentially avoidable deaths – deaths under the age of 75 from conditions that are potentially preventable through primary or hospital care, such as cancer screening and transport accidents – increased as remoteness increased. For information on examples and definitions of potentially avoidable deaths see Potentially avoidable deaths, 2022.
In 2021, 16% of all deaths in Australia were potentially avoidable (ABS 2023a). For males and females, the rate increased with increasing remoteness (Figure 7; Table S7). After adjusting for age and comparing with Major cities, the rates of potentially avoidable deaths were:
- 1.3 and 1.2 times as high in Inner regional areas for males and females
- 1.5 times as high in Outer regional areas for both males and females
- 2–3 times higher in Remote and Very remote areas (AIHW 2023h).
Figure 7: Potentially avoidable deaths by sex and remoteness area, 2021
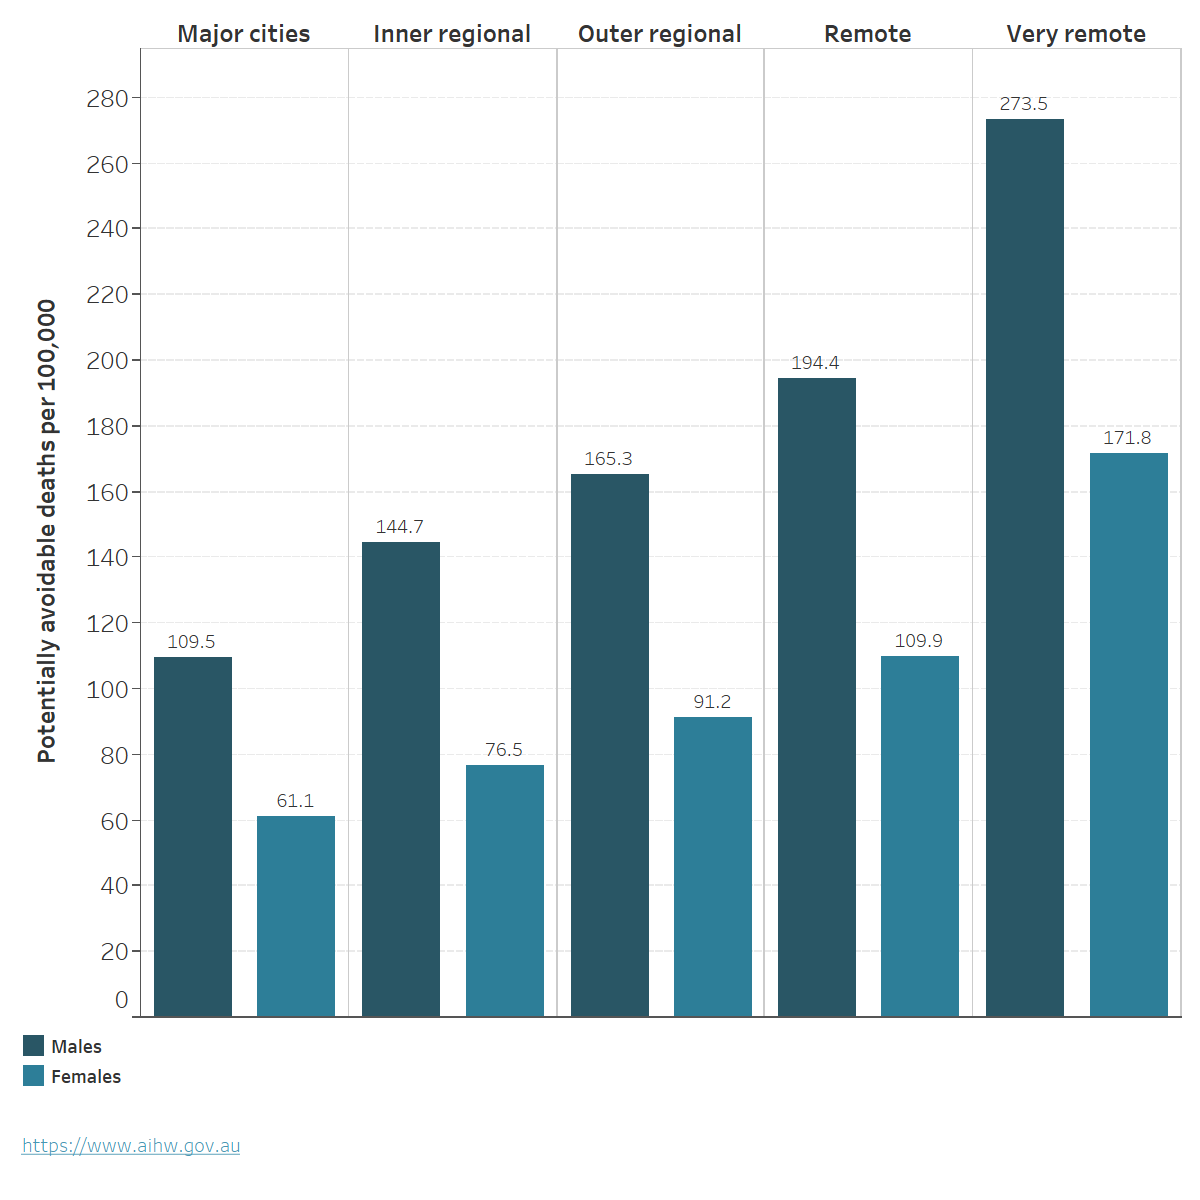
Chart: AIHW. Source: AIHW 2023h; Table S7.
For more information, see Mortality Over Regions and Time (MORT) books
Life expectancy
Estimates of life expectancy at birth represent the average number of years that a newborn baby can expect to live, assuming current age-specific death rates are experienced through their lifetime. In 2020–2022, life expectancy at birth was lower for those living outside of metropolitan areas (greater capital city) (Table 2; ABS 2023d).
| Males | Females | Persons | |
|---|---|---|---|
| Greater Sydney | 82.5 | 86.2 | 84.3 |
| Rest of NSW | 79.5 | 84.1 | 81.7 |
| Greater Melbourne | 82.3 | 86.0 | 84.1 |
| Rest of Vic. | 79.5 | 84.1 | 81.8 |
| Greater Brisbane | 81.2 | 85.3 | 83.2 |
| Rest of Qld | 80.3 | 84.8 | 82.5 |
| Greater Adelaide | 81.3 | 85.4 | 83.3 |
| Rest of SA | 80.1 | 84.3 | 82.2 |
| Greater Perth | 82.4 | 86.5 | 84.4 |
| Rest of WA | 79.4 | 83.7 | 81.5 |
| Greater Hobart | 80.6 | 85.1 | 82.8 |
| Rest of Tas. | 79.9 | 83.7 | 81.8 |
| Greater Darwin | 79.1 | 84.6 | 81.8 |
| Rest of NT | 71.6 | 75.8 | 73.7 |
Source: ABS 2023d.
Access to health care
People living in remote and very remote areas can face barriers to accessing and using health care, due to various challenges: geographic spread, low population density, limited infrastructure, and the higher costs of delivering rural and remote health care can limit the availability of services. The additional time and transportation costs to access health care services also means people in remote and very remote areas may delay access to preventive and primary health care and rely on hospital care to have their needs met (NRHA 2023).
Primary health care
Medicare claims data from 2022–23 show that the number of non-hospital non-referred attendances per person, such as general practitioner (GP) visits, were lowest in Remote communities (MM 6) and Very remote communities (MM 7) (4.2 and 3.4 per person respectively) (Table 3). However, bulk-billing rates were highest in Very remote communities (MM 7) (89%), lowest in Regional centres (MM 2) (75%) and similar across all other MMM areas (Table 3).
| Modified Monash (MM) category | Total number of GP Non-referred Attendances | Number of GP Non-referred Attendances per person | Number of Bulk-billed GP Non-referred Attendances | Per cent Bulk-billed GP Non-referred Attendances |
|---|---|---|---|---|
| Metropolitan areas (MM 1) | 122.1 million | 6.6 | 99 million | 80 |
| Regional centres (MM 2) | 14 million | 6.1 | 11 million | 75 |
| Large rural towns (MM 3) | 10.4 million | 6.3 | 8.2 million | 79 |
| Medium rural towns (MM 4) | 6.4 million | 6.4 | 5.1 million | 80 |
| Small rural towns (MM 5) | 11.1 million | 6.2 | 9 million | 81 |
| Remote communities (MM 6) | 1.2 million | 4.2 | 978,000 | 79 |
| Very remote communities (MM 7) | 706,000 | 3.4 | 628,000 | 89 |
Note: The number of GP non-referred attendances per person was calculated using the Estimated Resident Population at 30 June 2022.
Source: Department of Health and Aged Care 2023a.
Cancer Screening
Participation in bowel, breast and cervical cancer screening varies with remoteness:
- In 2020–2021, the bowel cancer screening participation rate for people aged 50–74 was highest for people living in Inner regional areas (43%) and lowest for people living in Very remote areas (25%) (AIHW 2023i).
- In 2020–2021, the breast cancer screening participation rate for females aged 50–74 was highest in Outer regional and Inner regional areas at 55% and 52%, respectively, and lowest for participants living in Very remote areas at 37% (AIHW 2023e).
- In 2018–2022, the cervical screening participation rate for females aged 25–74 years was similar but declined across remoteness areas, from 70% in Major cities to 65% in Outer regional areas and 60% in Very remote areas (AIHW 2023j).
For more information, see General practice, allied health and other primary care services and Cancer screening.
Health workforce
Australians living in rural, Remote and Very remote communities generally have poorer access to healthcare than people in Regional centres and Metropolitan areas, and may need to travel long distances or relocate to attend health services or receive specialised treatment (AIHW 2022a). The clinical FTE rate indicates the full-time equivalent number of health professionals working clinical hours relative to the population. In 2016–2021 the clinical FTE per 100,000 population was:
- highest in Metropolitan areas (MM 1) for many health professionals including specialists (all doctors other than GPs who require a referral from another doctor), occupational therapists, dentists, pharmacists, physiotherapists, psychologists.
- higher in Large rural towns (MM 3) compared with Metropolitan areas (MM 1) for optometrists, podiatrists and nurses and midwives.
- highest in Large rural towns (MM 3), Medium rural towns (MM 4), and Remote (MM 6) and Very remote (MM 7) communities for GPs.
- lowest in Small rural towns (MM 5), for all health professionals (including GPs) except for pharmacists. (Department of Health and Aged Care 2022) (Figure 8; Table S8).
Although the FTE rate for GPs increases with increasing remoteness, care should be taken in interpreting the data, as work arrangements in these areas have the potential to be more complicated (NRHA 2019). For example, there may be poor differentiation between general practice for on-call hours, activity for procedures and hospital work for GPs working in rural and remote areas, which affects the accuracy of statistics on GP supply and distribution (Walters et al. 2017).
For more information, see Health workforce.
Figure 8: Employed health professionals, clinical full-time equivalent (FTE) rate, by Modified Monash (MM) category
This chart shows the clinical FTE rate of health professionals including dentists, general practitioners, nurses and midwives, occupational therapists, optometrists, pharmacists, physiotherapists, podiatrists, psychologists and specialists by area of remoteness and year. In 2016–2021, the clinical FTE rate of most health professionals was highest in Metropolitan Areas (MM1) except optometrists, podiatrists, nurses and midwives and GPs. The clinical FTE rate for all health professionals was lowest in Small rural towns (MM5), except for pharmacists.

Notes:
- Calculations are based on the FTE clinical rate and report health practitioners working in clinical practice using the Estimated Resident Population of that year.
- FTE clinical rates are equal to the FTE number per 100,000 population, which is based on total weekly hours worked. For medical practitioners, the standard working week is 40 hours and for all other health practitioners it is 38 hours.
- Modified Monash (MM) category is derived from Modified Monash (MM) category of main job where available; otherwise, Modified Monash (MM) category of principal practice is used as a proxy.
- Numbers represent not only those in the labour force, but those employed and working in their registered profession.
Sources: ABS 2022a; Department of Health 2022a; Table S8.
Hospitalisations
In 2021–22, the number of hospitalisations per 1,000 people was similar for Major cities and regional areas (AIHW 2023b). People living in Very remote areas were hospitalised at almost twice the rate as people living in Major cities and those in Remote areas at 1.3 times the rate, with no improvement since 2013–14 (Figure 9; AIHW 2023b).
Figure 9: Hospitalisations, by remoteness area of usual residence, public and private hospitals, 2013–14 to 2021–22
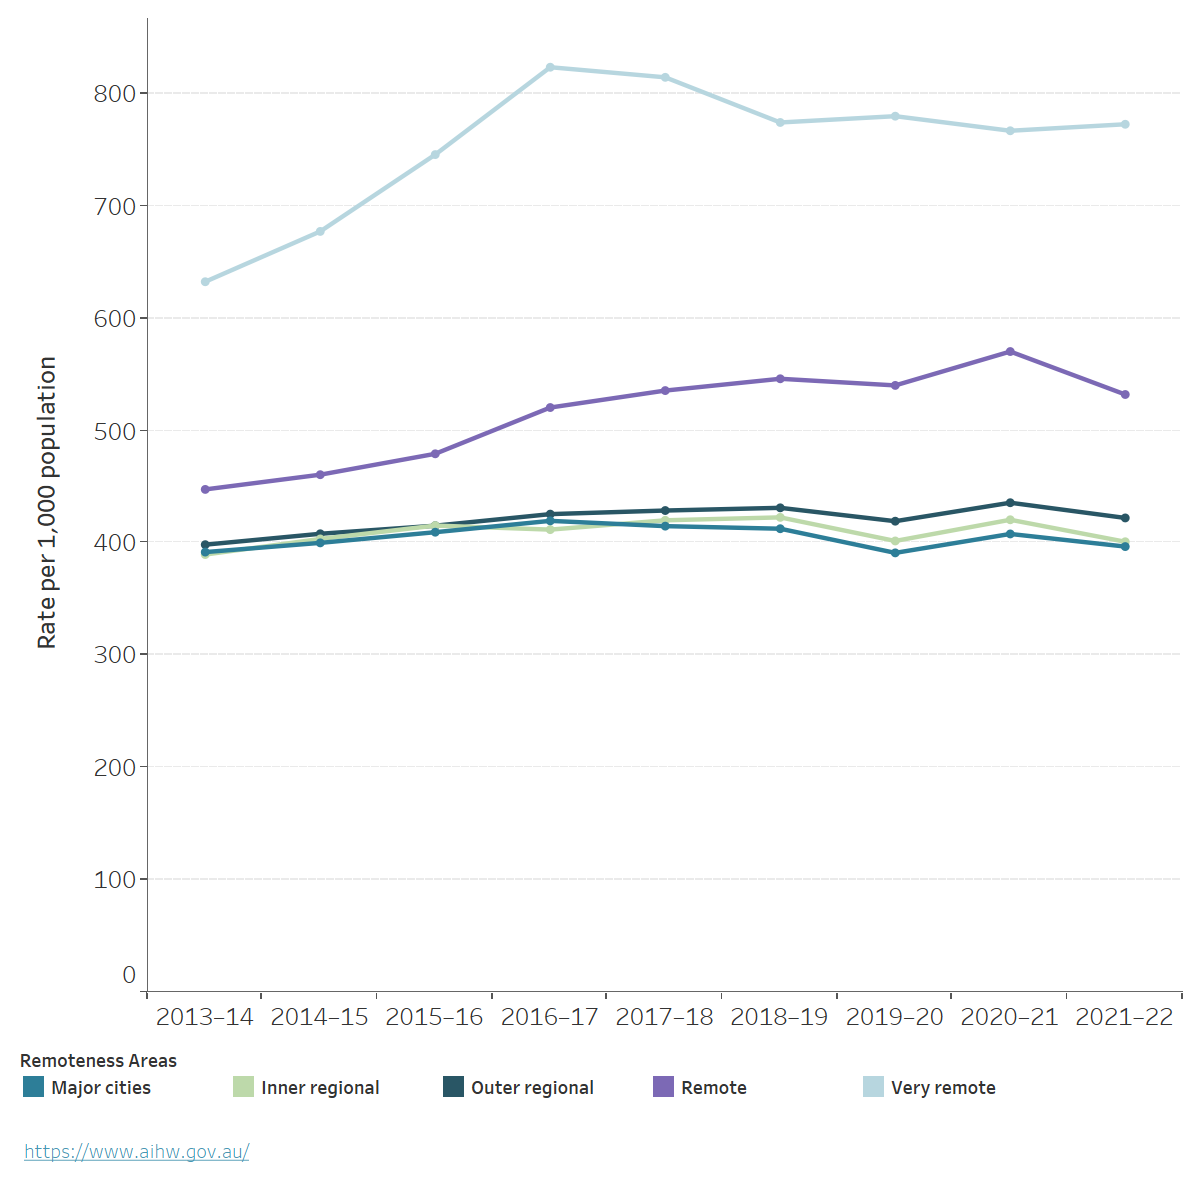
Notes:
- Separations per 1,000 population are reported as directly age-standardised rates based on Australian population as at 30 June of the year of interest, the Australian population as at 30 June 2001 was used as the reference population.
- Remoteness of area of usual residence is based on the patient's area of residence (provided at Statistical Area level 2)
Chart: AIHW. Source: AIHW 2023b; Table S9.
Overall, there was a decrease in the rate of all hospitalisations in 2021–22 across all remoteness areas except for Very remote areas, which could be due to the impact of COVID-19 on provision of healthcare services and reduced flow of patients seeking in-hospital care (AIHW 2023a).
People in Major cities have higher rates of rehabilitation care hospitalisations compared with people living in other remoteness areas (Figure 10; Table S10; AIHW 2023c). In 2021-22, there were 14 hospitalisations per 1,000 population living in Major cities compared with 8 for Inner regional areas, 6 for Outer regional areas, 3 for both Remote and Very remote areas. In part, this may reflect the distribution of private hospitals across remoteness areas, as private hospitals accounted for 81% of rehabilitation care separations (AIHW 2023c).
For more information, see Hospitals.
Figure 10: Hospitalisations for rehabilitation care, by remoteness area of usual residence, public and private hospitals, 2013–14 to 2021–22
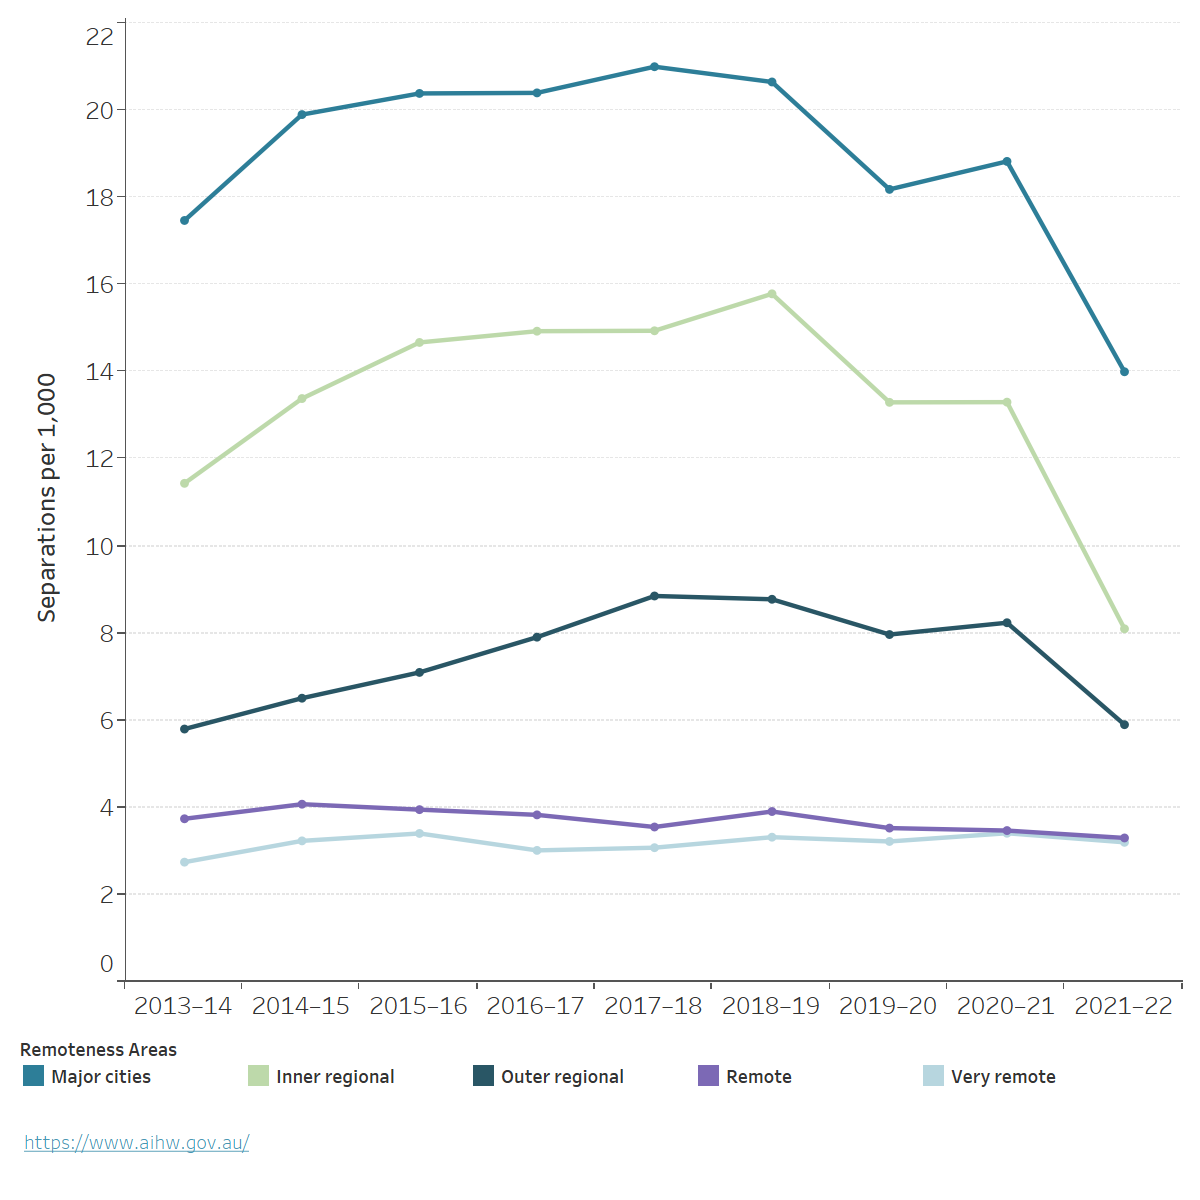
Notes:
1. Separations per 1,000 population are reported as directly age-standardised rates based on the Australian population as at 30 June of the year of interest. The Australian population as at 30 June 2001 was used as the reference population.
2. Separations for which care type was reported as Rehabilitation.
3. Remoteness of area of usual residence is based on patient's area of usual residence (provided as Statistical Area level 2).
Chart: AIHW. Source: AIHW 2023c; Table S10.
Potentially preventable hospitalisations
Potentially preventable hospitalisations (PPH) are for conditions where hospitalisation could have potentially been prevented through the provision of appropriate individualised preventative health interventions and early disease management, usually delivered in primary care and community-based settings. The rate of PPH increases with remoteness and is highest in Very remote and Remote areas (Figure 11; Table S11; AIHW 2023d).
When compared with Major cities, the rate of PPH in 2021–22 was:
- slightly higher in Inner regional and Outer regional areas (1.1 and 1.2 times as high, respectively)
- 2–3 times as high for people living in Remote and Very remote areas (AIHW 2023d).
Figure 11: Potentially preventable hospitalisations, by remoteness area of usual residence, all hospitals, 2013–14 to 2021–22
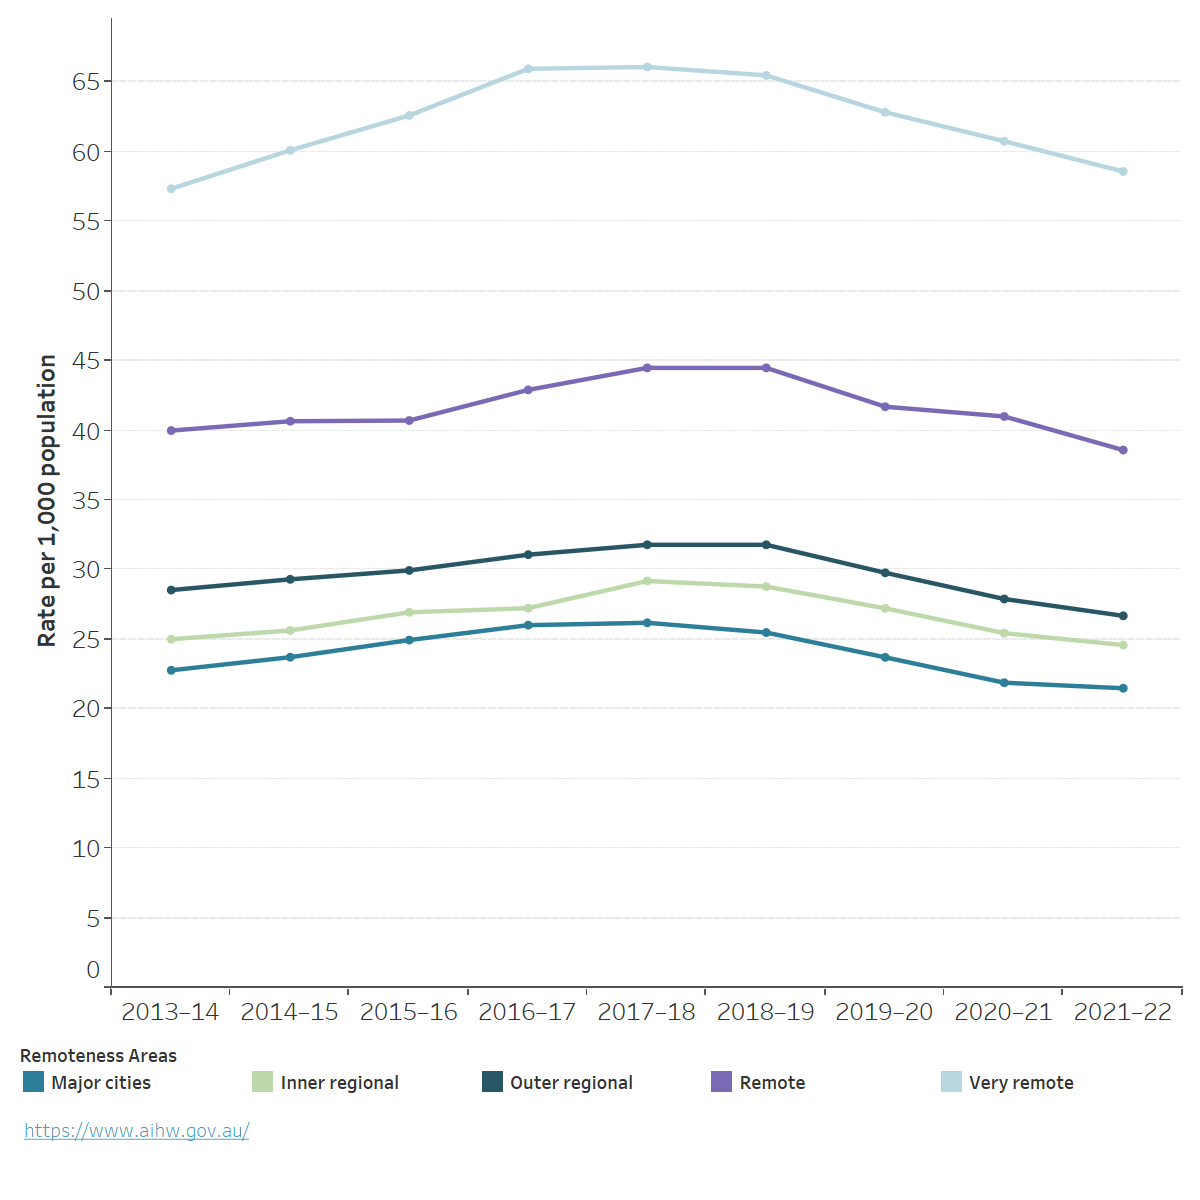
Notes
- Separations per 1,000 population are reported as directly age-standardised rates based on the Australian population as at 30 June of the year of interest. The Australian population as at 30 June 2001 was used as the reference population.
- Remoteness of area of usual residence is based on the patient's area of residence (provided as Statistical Area level 2 for most jurisdictions)
Chart: AIHW. Source: AIHW 2020, AIHW 2023d, Table S11.
Where do I go for more information?
For more information on rural and remote health please see:
- Australian Burden of Disease Study: impact and causes of illness and death in Australia 2018
- Mortality Over Regions and Time (MORT) books
- Admitted patients
- Cancer statistics for small geographic areas
- National Rural Health Alliance
- Glossary
For more on this topic, visit Rural and remote Australians.