Hospitals – Admitted patient palliative care
On this page:
In 2021–22, there were 94,800 hospitalisations where palliative care was provided during all or part of the episode of care in Australia. This section provides information related to these hospitalisations and the characteristics of people admitted for palliative care over the period 2015–16 to 2021–22. It also presents information on expenditure for palliative care in public hospitals. Further information on hospitalisations for palliative care can be found in Data sources and Technical information: Identifying palliative care-related hospitalisations.
The information in this section was last updated in November 2023.
People with life-limiting illness may require care in a hospital setting, such as a hospital ward (specialist palliative care ward or other areas of the hospital), an emergency department or an outpatient clinic.
Palliative care-related hospitalisations refer to those episodes of admitted patient care where palliative care was a component of the care provided during all or part of the episode. These hospitalisations can be divided into 2 groups depending on how they are identified in the hospital data:
- primary palliative care hospitalisations: hospitalisations with a recorded care type of palliative care
- other palliative care hospitalisations: hospitalisations with a recorded diagnosis of palliative care, but the care type is not recorded as palliative care.
For more information, see Technical information: Identifying palliative care-related hospitalisations.
Key points
In 2021–22, among 94,800 palliative care-related hospitalisations based on data from the National Hospital Morbidity Database:
- more than half (53%) were for males
- almost 3 in 5 (58%) were for people aged 75 and over
- 51,300 were for primary palliative care and 43,500 for other palliative care, equating to 19.9 and 16.9 per 10,000 population, respectively
- 2 in 5 (40%) had a principal diagnosis of cancer – 1 in 2 (49%) for primary palliative care hospitalisations and almost 1 in 3 (29%) for other palliative care hospitalisations
- average length of stay was almost twice as long as for all overnight hospitalisations (hospitalisations that exclude same-day stays) – 10.3 days (9.3 days for primary palliative care and 11.5 days for other palliative care) compared with 5.7 days for all hospitalisations
- 2 in 3 (67%) primary palliative care hospitalisations ended with the patient dying in hospital compared with 43% for other palliative care hospitalisations.
Between 2015–16 and 2021–22, there was a 29% increase in the number of palliative care-related hospitalisations – this increase was at a steeper rate than for all hospitalisations (10% increase) over the same period.
Based on data from the National Hospital Cost Data Collection, the total palliative care expenditure in public hospitals was $481.4 million (19% of all sub-acute care costs or 1.1% of total cost in these public hospitals) in 2020–21. The average cost per palliative care episode was $13,300 and per palliative care phase was $7,800.
Characteristics of people hospitalised for palliative care
This section presents information on in-patient admitted palliative care-related hospitalisations, sourced from the National Hospital Morbidity Database (NHMD), which includes demographic, clinical and administrative information on patients. This annual collection is compiled and maintained by Australian Institute of Health and Welfare (AIHW), using data supplied by state and territory health authorities. Information from almost all hospitals in Australia is included in the database: from public acute and public psychiatric hospitals, private acute and psychiatric hospitals, and from private free-standing day hospital facilities (Appendix A, AIHW 2022). The latest available data for inclusion in this report was 2021–22.
The NHMD is episode-based, with the term ‘hospitalisation’ used to refer to an episode of admitted patient care; individual patients may have multiple hospitalisations ending in discharge, transfer, or statistical discharge with a change in care type and ultimately death. Thus, a single patient may have 2 or more hospitalisations during any one hospital stay. Since each record within the NHMD is based on an episode of care, the hospitalisation count is a count of episodes, not persons.
In cases of more than one care type, length of stay refers to the length of the episode of care, not the total duration of a patient’s hospital stays.
In 2021–22, there were 11.6 million hospitalisations across Australia, including 94,800 hospitalisations where palliative care was provided during all or part of the episode of care (referred to as palliative care-related hospitalisations, see Identifying palliative care in hospital data for further details). More than half of these hospitalisations (54% or 51,300) had a care type of palliative care (referred to as primary palliative care hospitalisation), while 43,500 had a diagnosis of palliative care but the type of care delivered was not recorded as palliative care (referred to as other palliative care hospitalisation). This equates to 19.9 primary palliative care hospitalisations per 10,000 population and 16.9 other palliative care hospitalisations per 10,000 population, respectively (Table APC.1).
Most of the palliative care-related hospitalisations were recorded in public hospitals (85%), a higher proportion than that recorded for all hospitalisations (59%, Table APC.2).
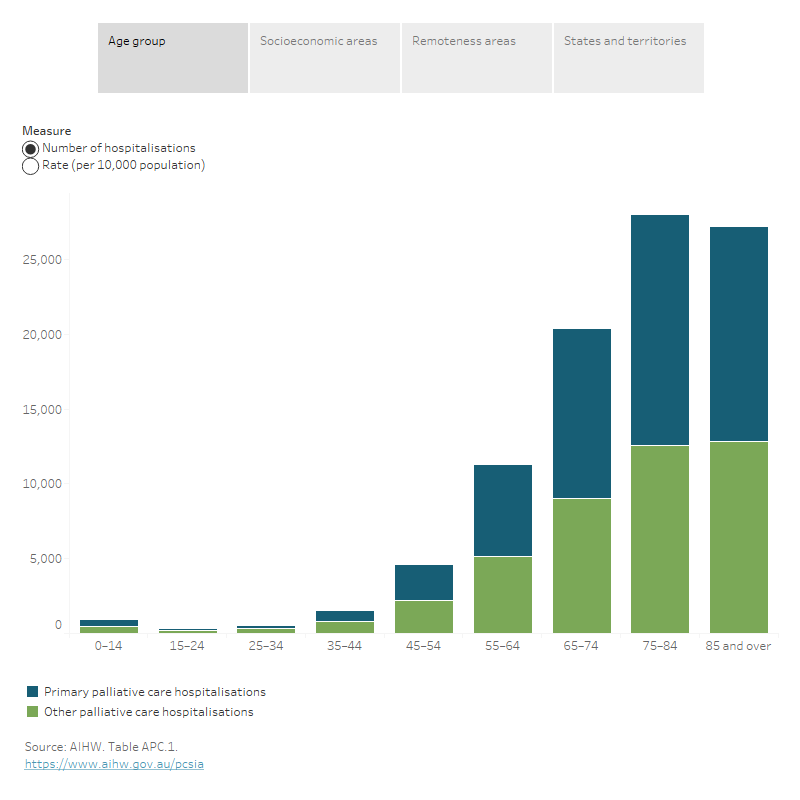
In 2021–22, among 94,800 palliative care-related hospitalisations (Figure APC.1):
- Males accounted for over half (53%) – a different pattern to that for hospitalisations for all reasons where females accounted for more than half (52%; Table APC.1).
- Almost 3 in 5 (58%) were for people aged 75 and over – the average age at admission for palliative care-related hospitalisations was 75 years. This is considerably older than for hospitalisations for all reasons (56 years). Less than 1 in 10 (8.4%) palliative care-related hospitalisations were for people aged under 55 (Table APC.1).
- 2,500 Aboriginal and Torres Strait Islander (First Nations) people had a palliative care-related hospitalisation. The majority of these hospitalisations occurred in public hospitals (95%) – a higher proportion than for all hospitalisations (86%; Table APC.2).
- People living in the lowest socioeconomic areas had hospitalisation rates in public hospitals twice as high as those in the highest socioeconomic areas – 43 compared with 22 per 10,000 population. Conversely, in private hospitals people living in the highest socioeconomic areas had palliative care-related hospitalisation rates 2.5 times as high as those in the lowest socioeconomic areas (8.6 compared with 3.5 per 10,000 population, respectively). These overall patterns were also observed for hospitalisations for all reasons (Table APC.3).
Figure APC.1: Demographic and geographical characteristics of people hospitalised for palliative care, 2021–22
Figure 1.1: The interactive data visualisation shows the number and rate of primary palliative care hospitalisations and other palliative care hospitalisations by age group in 2021–22. The number of primary palliative care hospitalisations was highest among those aged 75–84, while the number of other palliative care hospitalisations was highest among those aged 85 and over. The rate (per 10,000 population) of hospitalisations generally increased with increasing age for both primary palliative care and other palliative care, with the highest rate for those aged 85 and over.
Figure 1.2: The interactive data visualisation shows the number and rate of primary palliative care hospitalisations and other palliative care hospitalisations by socioeconomic areas and sector in 2021–22. The number and rate (per 10,000 population) of primary palliative care and other palliative care hospitalisations in public hospitals decreased by increasing socioeconomic areas (1 lowest to 5 highest), while the reverse was observed in private hospitals.
Figure 1.3: The interactive data visualisation shows the number and rate of primary palliative care hospitalisations and other palliative care hospitalisations by remoteness areas and sector in 2021–22. For both hospitalisations, the number in public and private hospitals, and the rate (per 10,000 population) in private hospitals decreased by increasing remoteness areas (Major cities to Remote and Very remote areas combined).
Figure 1.4: The interactive data visualisation shows the number and rate of primary palliative care hospitalisations and other palliative care hospitalisations by states and territories and sector in 2021–22. In public hospitals, New South Wales had the highest number for primary palliative care hospitalisations and Victoria had the highest number for other palliative care hospitalisations. In private hospitals, Queensland had the highest number both for primary palliative care hospitalisations and other palliative care hospitalisations (with publishable data).
Variation across geographical areas
The rate of palliative care-related hospitalisations varied across remoteness categories and by public and private hospitals (Figure APC.1). In public hospitals, for primary palliative care hospitalisations people living in Inner regional and Outer regional areas had the highest rate – 21 and 24 per 10,000 population compared with 15 per 10,000 population in both Major cities and Remote and Very remote areas (combined). While for other palliative care hospitalisations, the rate of hospitalisations increased with increasing remoteness, consistent with the pattern for hospitalisations for all reasons. In private hospitals, the rate of palliative care-related hospitalisations decreased with increasing remoteness, consistent with the pattern for hospitalisations for all reasons (Table APC.4).
The rate of palliative care-related hospitalisations also varied across the states and territories – for example in public hospitals, ranging from 21 palliative care-related hospitalisations per 10,000 population in Western Australia to 46 hospitalisations per 10,000 population in Tasmania (Table APC.5).
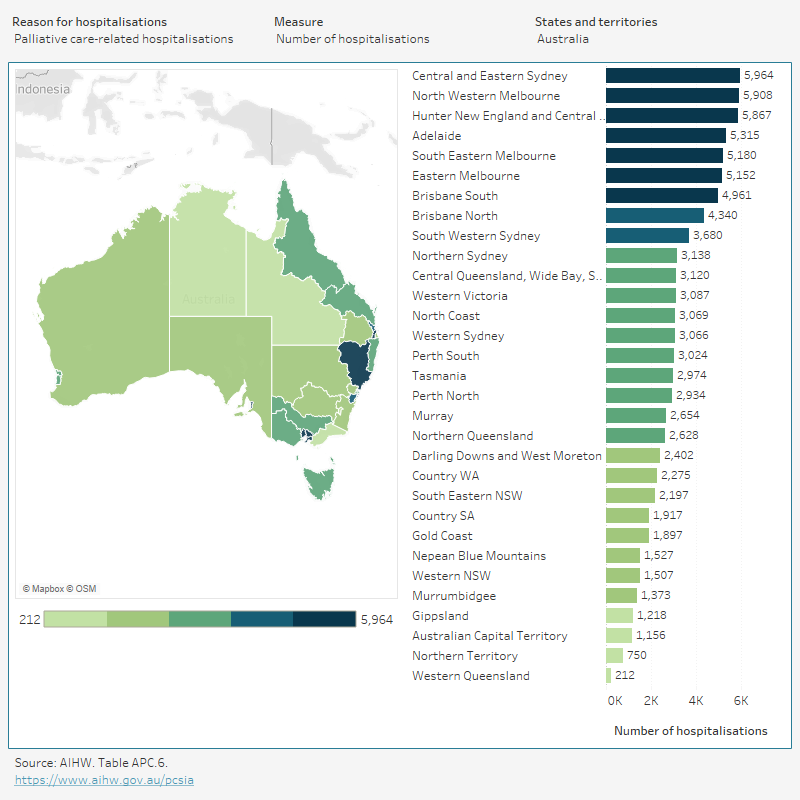
Across the Primary Health Networks (PHN) areas, the rate of palliative care-related hospitalisations ranged from 25 hospitalisations per 10,000 population in Australian Capital Territory PHN area to 57 hospitalisations per 10,000 population in New South Wales North Coast PHN area. For hospitalisations for all reasons, people living in Northern Territory PHN area had the highest rate (7,300 per 10,000 population), while people living in New South Wales Western Sydney PHN area had the lowest rate (3,100 per 10,000 population; Figure APC.2).
Figure APC.2: Palliative care-related hospitalisations, by Primary Health Networks (PHN) areas, 2021–22
Figure 2: The interactive data visualisation shows the number and rate of palliative care-related hospitalisations across Australia's 31 Primary Health Networks in 2021–22. The number of palliative care-related hospitalisations was highest in the Central and Eastern Sydney. While the rate (per 10,000 population) of palliative care-related hospitalisations was highest in North Coast.
Characteristics of hospital stay
Primary reason for hospitalisation
In 2021–22, among 94,800 palliative care-related hospitalisations, cancer was the most common principal diagnosis recorded for palliative care-related hospitalisations (40%) – 1 in 2 (49%) for primary palliative care hospitalisations and almost 1 in 3 (29%) for other palliative care hospitalisations (Figure APC.3).
- Secondary site cancer (cancer of an unknown or ill-defined primary site) was the most frequently recorded cancer (9.7% and 8.8% for primary palliative care and other palliative care hospitalisations, respectively), followed by lung cancer (7.6% and 3.6% for primary palliative care and other palliative care hospitalisations, respectively).
- Most frequently recorded principal diagnosis other than cancer was cerebrovascular disease (4.7%) and septicaemia (4.0%) for primary palliative care hospitalisations, and influenza and pneumonia (6.0%) and heart failure and complications and ill-defined heart disease (5.2%) for other palliative care hospitalisations.
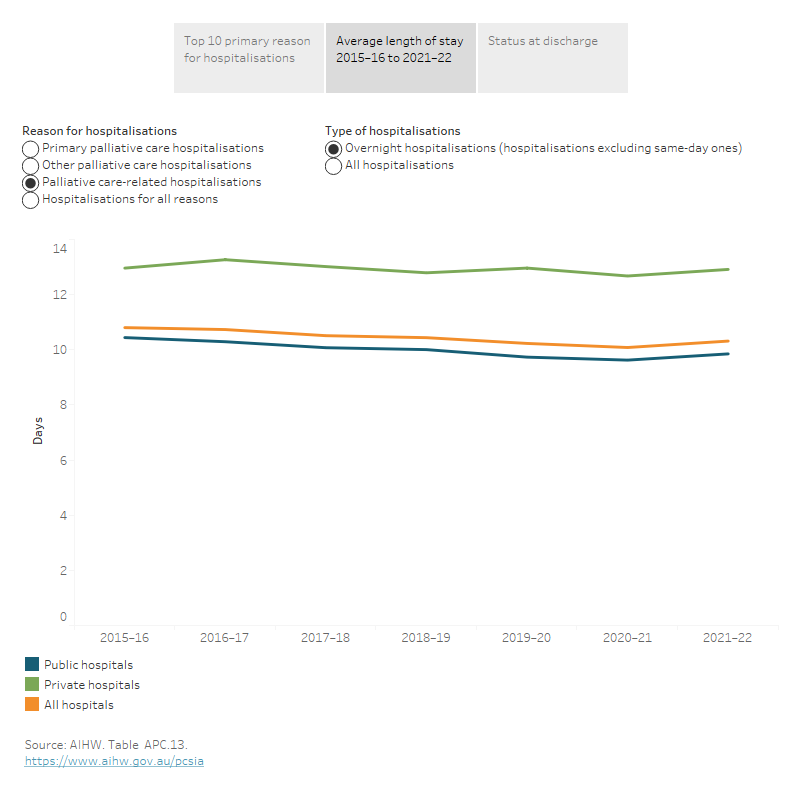
Average length of stay
In 2021–22, average length of stay for palliative care-related overnight hospitalisations (hospitalisations that exclude same-day stays) was almost twice as long as all overnight hospitalisations – 10.3 days (9.3 days for primary palliative care hospitalisations and 11.5 days for other palliative care hospitalisations) compared with 5.7 days for all hospitalisations (Figure APC.3). Among palliative care-related hospitalisations:
- Patients spent on average longer in private hospitals (12.9 days) than public hospitals (9.9 days) for overnight palliative care-related hospitalisations. In contrast, the average length of stay for overnight hospitalisations for all reasons in public hospitals (5.9 days) was slightly longer than in private hospitals (5.2 days).
- The average length of overnight palliative care-related hospitalisations varied across the states and territories, for example in public hospitals, ranging from 7.2 days in Queensland to 12.8 days in Australian Capital Territory.
- In public hospitals, the average length of stay has declined for primary palliative care overnight hospitalisations – from 10.1 days to 8.7 days between 2015–16 and 2021–22. In contrast, the average length of stay remained relatively stable for primary palliative care hospitalisations in private hospitals (around 12–13 days), other palliative care (around 11–12 days in all hospitals), and hospitalisations for all reasons (5.3–5.7 days in all hospitals) over the same period.
Status at discharge
In 2021–22, almost 3 in 5 (56% or 53,000) palliative care-related hospitalisations ended with the patient dying in hospital – 67% for primary palliative care hospitalisations (69% in public hospitals and 50% in private hospitals) and 43% for other palliative care hospitalisations (41% in public hospitals and 54% in private hospitals). The next most common status at discharge was to usual residence (26%) – 22% for primary palliative care hospitalisations and 31% for other palliative care hospitalisations (Figure APC.3).
In 2021–22, almost 2 in 3 (63%) of all people who died in hospital had received palliative care during their final hospitalisation – 41% for primary palliative care and 22% for other palliative care. This proportion was higher in patients with a principal diagnosis of cancer than non-cancer diagnosis (86% and 54% respectively; Table APC.7b).
Figure APC.3: Characteristics of palliative care-related hospital stay, 2021–22
Figure 3.1: The interactive data visualisation shows the Top 10 most common primary reasons for hospitalisations and for hospitalisations ending in death of primary palliative care hospitalisations and other palliative care hospitalisations in 2021–22. Cancers had the highest number for hospitalisations and hospitalisations ending in deaths for primary palliative care and other palliative care hospitalisations.
Figure 3.2: The interactive data visualisation shows the average length of stay for hospitalisations by reason for hospitalisations, type of hospitalisations and sector from 2015–16 to 2021–22. For palliative care-related hospitalisations, the average length of overnight hospitalisations in public hospitals declined from 10.4 days in 2015–16 to 9.9 days in 2021–22. While in private hospitals, the average length of overnight hospitalisations remained relatively stable (around 12–13 days) over the same period.
Figure 3.3: The interactive data visualisation shows the status at discharge for hospitalisations by reason for hospitalisations and sector in 2021–22. The most common reason for discharge for palliative care-related hospitalisations in both public and private hospitals was death, followed by discharge to usual residence. Meanwhile, discharge to usual residence was the most common reason for discharge for hospitalisations for all reasons both in public hospitals and private hospitals.
Principle funding source
Public and private hospitals both receive funding from the Australian Government, state and territory governments, private health insurance funds and out-of-pocket payments by individuals. However, the relative contributions made by these sources of funds vary across the sectors, reflecting the types of patients they treat, the services they provide, and the administrative arrangements in which they operate (AIHW 2021).
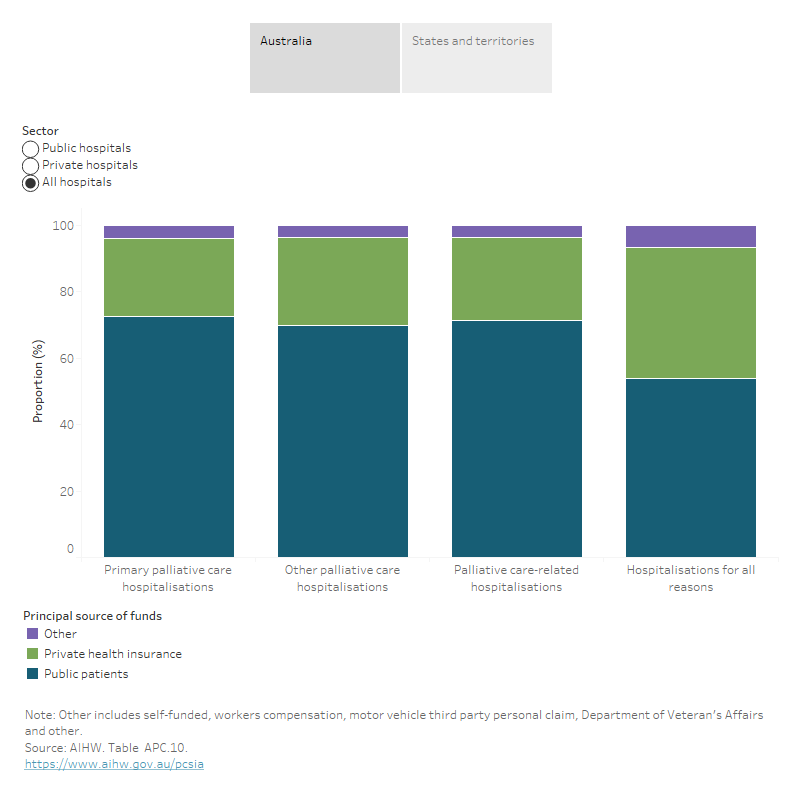
In 2021–22 (Figure APC.4):
- In public hospitals, public patient funding accounted for a lower proportion of palliative care-related hospitalisations (81%) than for all hospitalisations (87%). In contrast, private health insurance accounted for a higher proportion of funding for palliative care-related hospitalisations (16%) than for all hospitalisations (11%).
- In private hospitals, private health insurance was the funding source for 75% of palliative care-related hospitalisations, lower than that for all hospitalisations (80%).
Figure APC.4: Proportion of principle funding source for palliative care-related hospitalisations, by sector, 2021–22
Figure 4.1: The interactive data visualisation shows the principal source of funds for hospitalisations by reason for hospitalisations and sector in Australia in 2021–22. In public hospitals, public patient accounted for the highest proportion of funding for palliative care-related hospitalisations. While in private hospitals, private health insurance accounted for the highest proportion of funding for palliative care-related hospitalisations.
Figure 4.2: The interactive data visualisation shows the principal source of funds for hospitalisations by reason for hospitalisations and sector across states and territories in 2021–22. Across all states and territories, public patients contributed the largest proportion of funding for palliative care-related hospitalisations in public hospitals and all hospitals, while private health insurance accounted for the highest proportion of funding in private hospitals.
Trends
Between 2015–16 and 2021–22, the number of palliative care-related hospitalisations increased more rapidly than hospitalisations for all reasons – 29% increase (from 73,600 to 94,800) compared with 10% increase (from 10.5 to 11.6 million), respectively. Among palliative care-related hospitalisations, the increase was steeper for other palliative care hospitalisations than primary palliative care hospitalisations (37% compared with 22%, respectively). These increases in palliative care and all hospitalisations were observed in both public and private hospitals (Table APC.12).
While palliative care-related hospitalisations increased by 3–5% each year between 2015–16 and 2021–22, hospitalisations for all reasons have fluctuated over this period – increased between 2–4% between 2015–16 and 2018–19, then declined by 3% in the following 12 months followed by a steep increase (by 6%) in the 12 months to 2020–21. These falls and rises likely reflect the introduction of public health measures (such as lockdowns and business/activity restrictions) in the early months of the COVID-19 pandemic (in March–August 2020) to contain the spread of the virus, and the subsequent easing of restrictions in 2021. Hospitalisations for all reasons then declined again (by 2.1%) in the 12 months to 2021–22.
Between 2015–16 and 2021–22, the rate for palliative care-related hospitalisations also increased from 31 to 37 per 10,000 population. When adjusting for changes in the age structure of the population over this period, the changes in the hospitalisation rates were considerable smaller – increasing from 26 to 28 per 10,000 population between 2015–16 and 2021–22 (Figure APC.5). This suggests that the ageing of Australia’s population is contributing to the growth in palliative care-related hospitalisations.
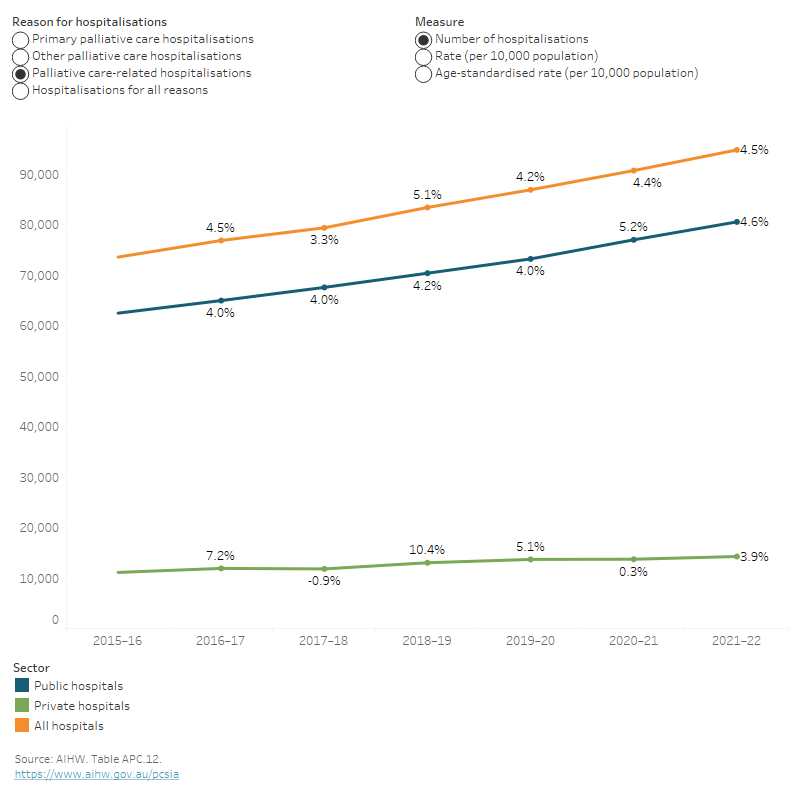
Figure APC.5: Trends in palliative care-related hospitalisations, by sector, 2015–16 to 2021–22
Figure 5: The interactive data visualisation shows the trends of hospitalisations by reason for hospitalisations and sector from 2015–16 to 2021–22. The number, rate (per 10,000 population) and age-standardised rate (per 10,000 population) of palliative care-related hospitalisations in public hospitals and all hospitals increased between 2015–16 and 2021–22, while it remained relatively stable for private hospitals over the same period.
In 2021–22, a total of 102 public acute hospitals reported having a specialist palliative care inpatient unit nationally according to National Public Hospital Establishments Database (NPHED). Note: In 2021–22, South Australia did not provide establishment-level data to NPHED on public acute hospitals, including public acute hospitals with a specialist palliative care inpatient unit. See Data sources and Hospital resources 2021–22: NPHED Data quality statement for further information on this data collection.
Expenditure on palliative care in public hospitals
The National Hospital Cost Data Collection (NHCDC) is an annual collection of public hospital cost data in Australia managed by the Independent Health and Aged Care Pricing Authority (IHACPA) and is the primary data collection used to develop the National Efficient Price (NEP) and National Efficient Cost (NEC) Determinations for the funding of public hospital services.
IHACPA uses classifications to categorise, cost and price hospital activity. Hospital activity relates to the management of (diagnostics and interventional) and the resources used by the patient in relation to their treatment. Classification systems are used to describe activity related to the following types of patient care: admitted acute care, subacute and non-acute care, non-admitted care, emergency care and mental health care. Palliative care is assigned to subacute care, a specialised multidisciplinary care in which the primary need for care is optimisation of the patient’s functioning and quality of life.
State and territory health departments submit their cost data to IHACPA. To support consistency in the costing process, IHACPA works with stakeholders to develop and implement national costing standards that prescribes the set of line items and cost centres used for mapping hospital costs. IHACPA then creates cost buckets as cost pools within the hospital, by combining line items and cost centres, which are made up of:
- Line items: these represent types of costs (for example, salaries and wages or goods and services) incurred by hospitals which are reported on in the general ledgers of hospitals.
- Cost centres: these represent departmental cost, objects within a hospital that relate to a particular function of the hospital – for example, the hospital operating room (IHACPA 2022).
The current version of the standards is the Australian Hospital Patient Costing Standards Version 4.1. For further information, see IHACPA's Data collection page.
In 2020–21, among the 340 public hospitals that reported subacute care data to the Independent Health and Aged Care Pricing Authority (IHACPA), 259 hospitals had provided palliative care to patients, with a hospital cost of $481.34 million. This represents 19% of all subacute care cost ($2.56 billion) and 1.1% of total cost ($44.49 billion) in these 259 hospitals (Table NHCDC.1).
In 2020–21, of the 36,100 palliative care episodes and 61,800 palliative care phases recorded, the average cost per palliative care episode was $13,300 and $7,800 per palliative care phase.
Almost half of this cost per episode related to ward nursing (34%) and ward medical (15%) cost buckets, 13% to ward supplies and 6% for allied health. Further, salaries and wages for nursing accounted for the biggest share (51%) of salaries for palliative care (line items), followed by salaries and wages for non-visiting medical officers (20%; Table NHCDC.1).
National Hospital Morbidity Database
Data on admitted patient palliative care are sourced from the National Hospital Morbidity Database (NHMD). These data pertain to admitted patients in public and private hospitals in Australia. Some of these hospitals have hospices affiliated with them.
The NHMD includes administrative data, demographic information on patients, and clinical information including diagnoses and procedures performed. This annual collection is compiled and maintained by the AIHW, using data supplied by state and territory health authorities. Information from almost all hospitals in Australia is included in the database: from public acute and public psychiatric hospitals, private acute and psychiatric hospitals, and from private free-standing day hospital facilities (Appendix A, AIHW 2022). The latest available data at the date of publication of this report was 2021–22.
Episode-based data
The NHMD is episode-based, with the term ‘hospitalisation’ used to refer to an episode of admitted patient care; individual patients may have multiple hospitalisations ending in discharge, transfer, or statistical discharge with a change in care type and ultimately death. Each record in the NHMD, is based on a single episode of treatment for an admitted patient, with such episodes classified in the 'Care type' data item as Acute care, Palliative care, Rehabilitation care, Newborn and other types of care. When a patient receives only one type of care during a hospital stay (such as only Acute care or only Palliative care), the length of stay for that hospitalisation is equal to the total length of time the patient spent in hospital during that stay.
However, where patients receive different types of care during one hospital stay (for example, a person may be admitted for active cancer treatment but then later reclassified as a palliative care patient), the patient may be statistically discharged from the hospital after the first type of care and then statistically readmitted into a second phase of care. Thus, a single patient may have 2 or more hospitalisations during any one hospital stay. Since each record within the NHMD is based on an episode of care, the hospitalisation count is a count of episodes, not persons. In cases of more than one care type, length of stay refers to the length of the episode of care, not the total duration of the patient’s hospital stays.
Coverage
For each of the years considered in this report, the coverage of the NHMD has been very good. For example, in 2021–22, coverage for the NHMD was high – data from all public hospitals were included (AIHW 2022). Most private hospitals also provided data, the exceptions being the private free-standing day hospital facilities and 2 overnight private hospitals in the Australian Capital Territory. Note that the data for private hospitals and all hospitals (public and private combined) in Tasmania, the Australian Capital Territory and the Northern Territory were not published for confidentiality reasons.
Hospitals may be re-categorised as public or private between or within years (see Local Hospital Networks/ Public hospital establishments National Minimum Data Set (NMDS) 2021–22 for further information). This should be considered when comparing data by sector over time.
Data on state/territory of hospitalisation should be interpreted with caution because of cross-border flows of patients. This is particularly the case for the Australian Capital Territory. In 2021–22, 19% of hospitalisations in the Australian Capital Territory public hospitals were for patients who lived in New South Wales.
The AIHW Indigenous identification in hospital separations data: quality report assessed the quality of Indigenous status identification in Australian public hospitalisations. The results of this study indicated that data for all jurisdictions should be used in any analyses of Indigenous hospitalisation rates and that the ‘true’ number of Aboriginal and Torres Strait Islander (First Nations) people was close to 9% higher than the number indicated in hospital records (AIHW 2013). This should be considered when interpreting the hospital data by Indigenous status. Note, no adjustment has been applied to the counts in the hospital data by Indigenous status in this report.
Standard admitted patient care data exclusions
As per the standard AIHW practice when analysing admitted patient data in the NHMD, the data presented in this report exclude those records for which the ‘Care type’ data item was reported as newborn (unqualified days only), hospital boarder or organ procurement (posthumous).
Further information
Comprehensive hospital statistics from the NHMD are released by the AIHW on an annual basis in Admitted patients (AIHW 2023) and further information about the NHMD can be obtained from those publications. Metadata information for the Admitted Patient Care and Local Hospital Networks/Public Hospital Establishments NMDS, that are the basis for the AIHW National Hospital Databases (AIHW 2022), are published in the AIHW’s online metadata registry (METEOR) – National Hospital Morbidity Database (NHMD), and the National Health Data Dictionary.
From 1 July 2013, care types have been reported using revised definitions, with the aim to improve consistency in reporting for the subacute and non-acute care types. Therefore, changes in the care type definitions should be considered when interpreting changes over time.
A complete Data quality statement for the NHMD 2021–22 database is available online.
National Public Hospital Establishments Database
The National Public Hospital Establishments Database (NPHED) holds establishment-level data for each public hospital in Australia, including public acute hospitals, psychiatric hospitals, drug and alcohol hospitals, and dental hospitals in all states and territories. The collection covers hospitals within the jurisdiction of the state and territory health authorities only. Hence, public hospitals not administered by the state and territory health authorities (hospitals operated by the Australian Government Department of Health and Aged Care, Department of Defence, or correctional authorities, for example, and hospitals located in offshore territories) are not included. The collection does not include data for private hospitals.
For 2021–22, the collection was based on the Local Hospital Networks/Public Hospital Establishments national minimum data set (LHN/PHE NMDS). Information is included on a hospital’s resources, expenditure, average available bed numbers, peer group, and the statistical local area and remoteness area of its location. For more information on the data collection method and other relevant data issues, refer to the 2021–22 NPHED Data quality statement (NPHED 2021).
National Hospital Cost Data Collection
The National Hospital Cost Data Collection (NHCDC) is an annual collection of public hospital cost data in Australia, managed by the Independent Health and Aged Care Pricing Authority (IHACPA), and is the primary data collection used to develop the National Efficient Price (NEP) and National Efficient Cost (NEC) Determinations for the funding of public hospitals services.
IHACPA uses classifications to categorise, cost and price hospital activity. Hospital activity relates to the management of (diagnostics and interventional) and the resources used by the patient in relation to their treatment. Classification systems are used to describe activity related to the following types of patient care: admitted acute care, subacute and non-acute care, non-admitted care, emergency care and mental health care. Palliative care belongs to subacute care, a specialised multidisciplinary care in which the primary need for care is optimisation of the patient’s functioning and quality of life.
The health departments of Australia’s states and territories submit their cost data to IHACPA. Taken together, the collection represents the primary source of information about the cost of treating patients in Australian hospitals. To support consistency in the costing process, IHACPA works with stakeholders to develop and implement national costing standards. The Standards prescribes the set of line items and cost centres used for mapping hospital costs. IHACPA then creates cost buckets as cost pools within the hospital, by combining line items and cost centres.
The current version of the standards is the Australian Hospital Patient Costing Standards Version 4.1. For more information about data specifications, see IHACPA's Data collection.
| Key concept | Description |
|---|---|
| Additional diagnosis | A condition or complaint either coexisting with the principal diagnosis or arising during the episode of admitted patient care, episode of residential care or attendance at a health care establishment. Additional diagnoses are recorded in accordance with ICD-10-AM Australian Coding Standards. |
| Admitted patients | Patients who undergo a hospital’s formal admission process to receive treatment and/or care. This treatment and/or care is provided over a period and can occur in hospital and/or in the person’s home (for hospital-in-the-home patients). |
| Age-standardisation | Method to remove the influence of age when comparing rates between population groups with different age structures. This is used as the rate of many diseases vary strongly (usually increasing) with age, and so too can service use, for example, hospitalisations – a population group with an older age structure will likely have more hospitalisations. The age structures of different populations are converted to the same ‘standard’ structure, and then the relevant rates, such as hospitalisations, that would have occurred within that structure are calculated and compared. |
| Average length of stay | The length of stay for an overnight patient is calculated by subtracting the date the patient is admitted from the date of separation and deducting any days the patient was ‘on leave’. Average length of stay refers to the average number of patient days for admitted patient episodes. Patients admitted and separated on the same day are allocated a length of stay of 1 day. |
| Care type | Care type refers to the overall nature of a clinical service provided to an admitted patient during an episode of care. Examples of care types are Acute care, Rehabilitation care, Palliative care and Geriatric evaluation and management. |
| Cost bucket | According to National Hospital Cost Data Collection (NHCDC), cost buckets represent different combinations of the line items and costs centres and can be considered as cost pools within the hospital. |
| Cost centre | According to National Hospital Cost Data Collection (NHCDC), cost centres represent departmental cost, objects within a hospital that relate to a particular function of the hospital – for example, the hospital operating room. |
| Episode of care | The period of admitted patient care between a formal or statistical admission and a formal or statistical separation. In this report, this is also referred to as a hospitalisation. |
| Funding source | The principal source of funds for an admitted patient episode (hospitalisation). |
| Hospitalisation | An episode of hospital care that starts with the formal admission process and ends with the formal separation process (synonymous with admission and separation). An episode of care can be completed by the patient’s being discharged, being transferred to another hospital or care facility, or dying, or by a portion of a hospital stay starting or ending in a change of type of care (for example, from acute to rehabilitation). |
| Index of Relative Socio-Economic Disadvantage | 1 of 4 Socio-Economic Indexes for Areas (SEIFA) compiled by the ABS. The Index of Relative Socio-Economic Disadvantage (IRSD) has been used in this report to indicate socioeconomic position for five groups (quintiles) – from the most disadvantaged (worst off or lowest socioeconomic area) to the least disadvantaged (best off or highest socioeconomic area). When the IRSD is used in this report, people living in the 20% of areas with the greatest overall level of disadvantage are described as living in the ‘lowest socioeconomic areas’. The 20% of people at the other end of the scale – those living in areas with the least overall level of disadvantage – are described as living in the ‘highest socioeconomic areas’. It is important to note that the IRSD reflects the overall or average socioeconomic position of the population of an area; it does not show how individuals living in the same area might differ from each other in their socioeconomic position. See Technical information: Classifications for further information. |
| Line item | According to National Hospital Cost Data Collection (NHCDC), line items represent types of costs (for example, salaries and wages or goods and services) incurred by hospitals which are reported on in the general ledgers of hospitals. |
| Other palliative care hospitalisations | Defined, for the purposes of this report, as hospitalisations with a recorded diagnosis of palliative care, but the care type is not recorded as palliative care. Further information can be found in the Technical information: Identifying palliative care-related hospitalisations section. |
| Overnight hospitalisation | An admitted patient who received hospital treatment for a minimum of 1 night (that is, admitted to, and has a separation from, hospital on different dates). |
| Primary palliative care hospitalisation | Defined, for the purposes of this report, as hospitalisations with a recorded care type of palliative care. Further information can be found in the Technical information: Identifying palliative care-related hospitalisations section. |
| Palliative care-related hospitalisations | Defined, for the purposes of this report, as episodes of admitted patient care (or hospitalisations) where palliative care was a component of the care provided during all or part of the episode. These hospitalisations can be divided into 2 groups depending on how they are identified in the hospital data:
|
| Palliative care phase | The stage of a patient's illness. The palliative care phase refers to a distinct clinical period which reflects the stage of the patient's illness. Palliative care phase provides a good indication of the type of care required by a palliative care patient. An episode of admitted patient palliative care may comprise of a single phase or multiple phases, depending on changes in the patient's condition. Phases are not sequential, and a patient may move back and forth between phases within the one episode of admitted patient palliative care. |
| Patient day | The occupancy of a hospital bed (or chair in the case of some same day patients) by an admitted patient for all or part of a day. |
| Primary Health Networks | Primary Health Networks (PHNs) were established on 1 July 2015. These networks are intended to play a critical role in connecting health services across local communities so that patients, particularly those needing coordinated care, have the best access to a range of health care providers, including practitioners, community health services and hospitals. Primary health networks work directly with general practitioners, other primary care providers, secondary care providers and hospitals. PHNs connect health services across a specific geographic area (a PHN area), with the boundaries defined by the Australian Government Department of Health and Aged Care (see Primary Health Networks (PHNs) national map of PHN boundaries for details). There are 31 PHN areas that cover the whole of Australia, which closely align with the state and territory local hospital networks. |
| Principal diagnosis | The diagnosis established after study to be chiefly responsible for occasioning an episode of admitted patient care (hospitalisation). Diagnoses are recorded using the relevant edition of the International statistical classification of diseases and related health problems, 10th revision, Australian modification (ICD-10-AM). |
| Private hospital | A privately (non-government) owned and operated institution catering for patients who are treated by a doctor of their own choice. Patients are charged fees for accommodation and other services provided by the hospital and relevant medical and paramedical practitioners. Acute care and psychiatric hospitals are included in this category as are private free-standing day facilities. |
| Public hospital | A hospital controlled by a state or territory health authority. Public hospitals offer free diagnostic services, treatment, care and accommodation to all eligible patients. |
| Specialist palliative care inpatient unit | A type of specialist unit delivering palliative care services and can include both free-standing hospices and/or palliative care wards within a hospital. |
| Status at discharge | Status at discharge was calculated using the variable of 'Separation mode' in Admitted Patient Care data. Status at separation of person (discharge/ transfer/ death) and place to which person is released, as represented by a code. For further information on 'Separation mode', refer to the Metadata Online Register. |
AIHW (Australian Institute of Health and Welfare) (2013) Indigenous identification in hospital separations data: quality report, AIHW, Australian Government, accessed 28 January 2023.
AIHW (2021) Health expenditure Australia 2019–20, AIHW, Australian Government, accessed 17 January 2023.
AIHW (2022a) Admitted patient care 2021–22 Appendix information, AIHW, Australian Government, accessed 13 October 2023.
AIHW (2022b) Admitted patient care NMDS 2021–22, AIHW, Australian Government, accessed 26 June 2023.
AIHW (2022c) Hospital resources 2021–22 Appendix information, AIHW, Australian Government, accessed 13 October 2023.
AIHW (2023) Admitted patients, AIHW, Australian Government, accessed 4 July 2023.
IHACPA (Independent Health and Aged Care Pricing Authority) (2023) National Hospital Cost Data Collection (NHCDC) Public Sector Report, 2020–21 financial year, IHACPA, Australian Government, accessed 19 October 2023.