Mental health services provided in emergency departments

About 287,500 mental health-related presentations

to public emergency departments in 2022–23, which was 3% of all presentations

27% had a principal diagnosis of Mental and behavioural disorders due to psychoactive substance use

making this the most frequent diagnosis

59% seen on time

based on triage status compared with 65% across all ED presentations

Hospital emergency departments (EDs) play a role in treating mental illness. People seek mental health-related services in EDs for a variety of reasons, often as an initial point of contact or for after-hours care (Morphet et al. 2012).

State and territory health authorities collect a core set of nationally comparable information on most public hospital emergency department (ED) presentations in their jurisdiction, which has been compiled annually into the National Non-Admitted Patient Emergency Department Care Database (NNAPEDCD).

This report currently shows national-level data only; state- and territory-level data will be published in this report later this year. Data reported on this page for wait times and length of stay will be available for download when state- and territory-level data are released.   

Mental health-related ED presentations in this report are defined as presentations to public hospital EDs that have a principal diagnosis of Mental and behavioural disorders. More details about NNAPEDCD and identifying mental health presentations are available in the data source section. 

Spotlight data

Summary of mental health-related presentations to emergency departments activity

Infographic containing: 1) Number and rate (per 10,000) of mental health-related emergency department (ED) presentations from 2014–15 to 2022–23; 2) Primary diagnoses in mental health presentations to EDs from 2014–15 to 2022–23; 3) Percentage of mental health-related ED presentations triaged as Urgent, Emergency or Resuscitation during 2022–23 (74%); and 4) Percentage of mental health-related ED presentations classified as seen on time during 2022–23 (59%). 

Source: Mental health services provided in emergency departments 2022–23 tables

Service provision

In 2022–23, there were about 287,500 public hospital ED presentations with a mental health-related principal diagnosis recorded, representing 3% of all ED presentations. This is in line with mental health-related ED presentations as a proportion of all ED presentations since 2014–15, which has ranged between 3% and 4%. Nationally, the rate of mental health-related ED presentations in 2022–23 was 109 per 10,000 population. 

Table ED.1 Mental health-related ED presentations in public hospitals, national frequency statistics, 2022–23

Statistic

Number

Total mental health-related presentations

287,419

Median mental health-related presentations per day

788

Number of mental health-related presentations on busiest day

1,071

Date of busiest day

01 Jan 2023


Who presents to emergency departments?

Figure ED.1: Mental health-related ED presentations, by patient demographic characteristics, 2022–23

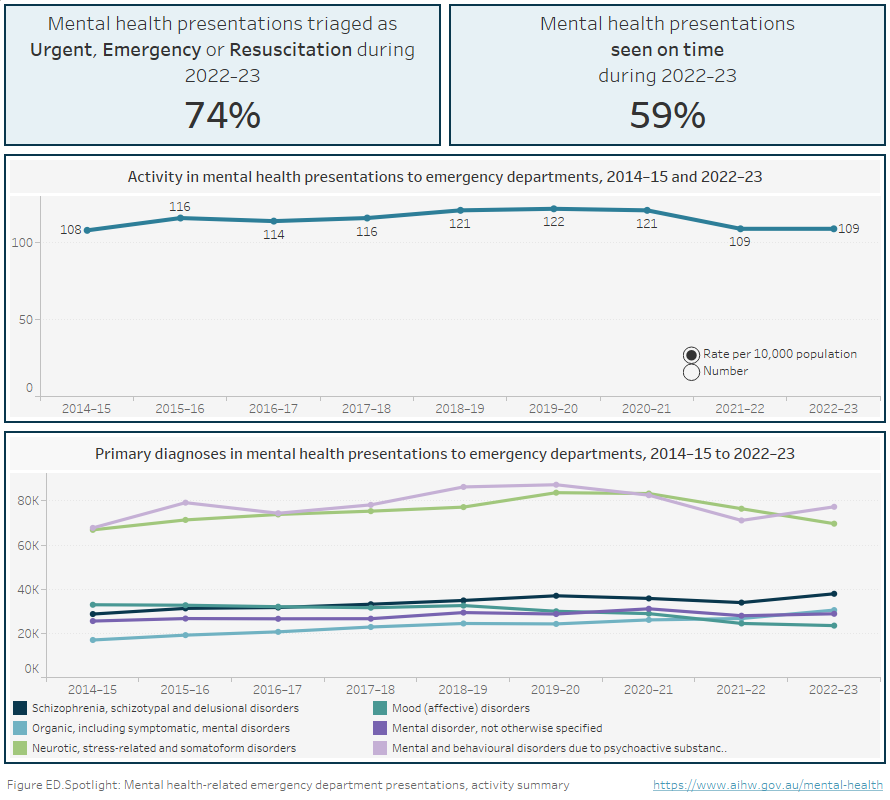
Figure ED.1 Horizontal bar chart showing the rate (per 10,000 population specific) of mental health-related emergency department presentations in public hospitals by patient demographics in 2022–23. Patients 85 years and over had the highest rate of mental health-related ED presentations at 221, followed by 18–24 years (174), 25–34 (150), 35–44 (143), 12–17 (132), 45–54 (125), 75–84 (103), 55–64 (81), 65–74 (58), and 0–11 (13). Males presented at a slightly higher rate than females (111 and 107 respectively). First Nations Australians presented at a higher age-standardised rate than non-Indigenous Australians (491 and 94 respectively). The rate increased with increasing remoteness of remoteness area of usual residence: 97 per 10,000 in Major cities, 114 in Inner regional areas, 126 in Outer regional areas and 239 in Remote and Very remote areas. Mental health-related presentations increased with increasing social disadvantage with 144 presentations per 10,000 for the most disadvantaged quintile (Quintile 1), followed by 125 (Quintile 2), 96 (Quintile 3), 89 (Quintile 4) and 74 for the least disadvantaged quintile (Quintile 5). Refer to Table NED.4.


Figure ED.1.1 Line chart of rate of mental health-related emergency department presentations (per 10,000 population) for age group by sex, 2014–15 to 2022–23. Refer to Table NED.4.


Figure ED.1.2 Line chart of mental health-related emergency department presentations (per 10,000 population) by demographic characteristics, 2014–15 to 2022–23. Refer to Table NED.4.

Note: Rates within the Indigenous status category have been age standardised. 

Source: Mental health services provided in emergency departments 2022–23 tables, Table NED.4

Department of Veterans’ Affairs

Men who have ever served in the Australian Defence Forces are more likely to report a mental or behavioural condition compared to those who have never served (27% compared with 17%; AIHW 2024). In 2022–23, a total of 1,435 mental health-related ED presentations had a DVA status of ‘Yes’, meaning the patients’ care was funded by the Department of Veterans’ Affairs (DVA). This represents less than 1% of all mental health-related ED presentations. Of the ED presentations for which the care was funded by DVA, 3% were mental health-related presentations. 

Table ED.2 Mental health-related ED presentations in public hospitals by DVA status, 2022–23 

DVA Status

Number

Per cent

Yes

1,435

<1%

No

284,341

99%

Total

287,419

100%

Principal diagnosis

Data on mental health-related ED presentations by principal diagnosis is based on the broad categories within the Mental and behavioural disorders chapter of the ICD‑10‑AM (Chapter 5). More details on diagnosis codes can be found in the data source section. 

Three quarters (75%) of mental health-related ED presentations in Australian public EDs were classified by 4 principal diagnosis groupings in 2022–23 (Figure ED.2):

  • Mental and behavioural disorders due to psychoactive substance use (F10–F19) (27%)
  • Neurotic, stress-related and somatoform disorders (F40–F49) (24%)
  • Schizophrenia, schizotypal and delusional disorders (F20–F29) (13%)
  • Organic, including symptomatic mental disorders (F00–09) (11%).

Figure ED.2: Mental health-related ED presentations, by principal diagnosis, 2022–23

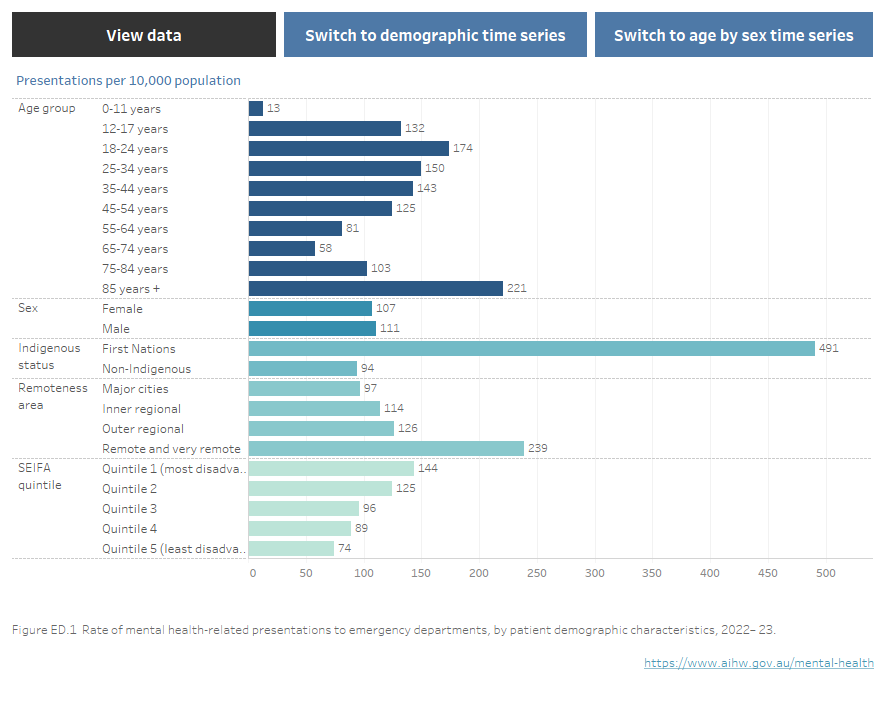
Figure ED.2: Horizontal bar chart showing mental health-related emergency department presentations in public hospitals by principal diagnosis in 2022–23. The majority of presentations were for Mental and behavioural disorders due to psychoactive substance use, making up 27% of presentations, followed by Neurotic, stress-related and somatoform disorders, 24%, Schizophrenia, schizotypal and delusional disorders, 13%; Organic, including symptomatic, mental disorders, 11%; Mental disorder, not otherwise specified 10%; Mood (affective) disorders 8%; Behavioural and emotional disorders with onset usually occurring in childhood and adolescence, 3%; Disorders of adult personality and behaviour, 2%; Behavioural syndromes associated with physiological disturbances and physical factors, 2%; and Disorders of psychological development and Mental retardation (reported as combined categories due to low numbers) >1%. 

Key

F00–09: Organic, including symptomatic, mental disorders
F10–19: Mental and behavioural disorders due to psychoactive substance use
F20–29: Schizophrenia, schizotypal and delusional disorders
F30–39: Mood (affective) disorders
F40–49: Neurotic, stress-related and somatoform disorders
F50–59: Behavioural syndromes associated with physiological disturbances and physical factors
F60–69: Disorders of adult personality and behaviour
F70–79; F80–89: Mental retardation; Disorders of psychological development
F90–98: Behavioural and emotional disorders with onset usually occurring in childhood and adolescence
F99: Mental disorder, not otherwise specified

Note: ICD-10-AM codes F70-F79 (Mental retardation) and F80-F89 (Disorders of psychological development) are reported as one category due to small numbers. The grouping is not related to characteristics of the conditions.

Source: Mental health services provided in emergency departments, 2022-23 tables, Table NED.5

Figure ED.3: Mental health-related presentations and total presentations to public EDs, by triage category, 2022–23

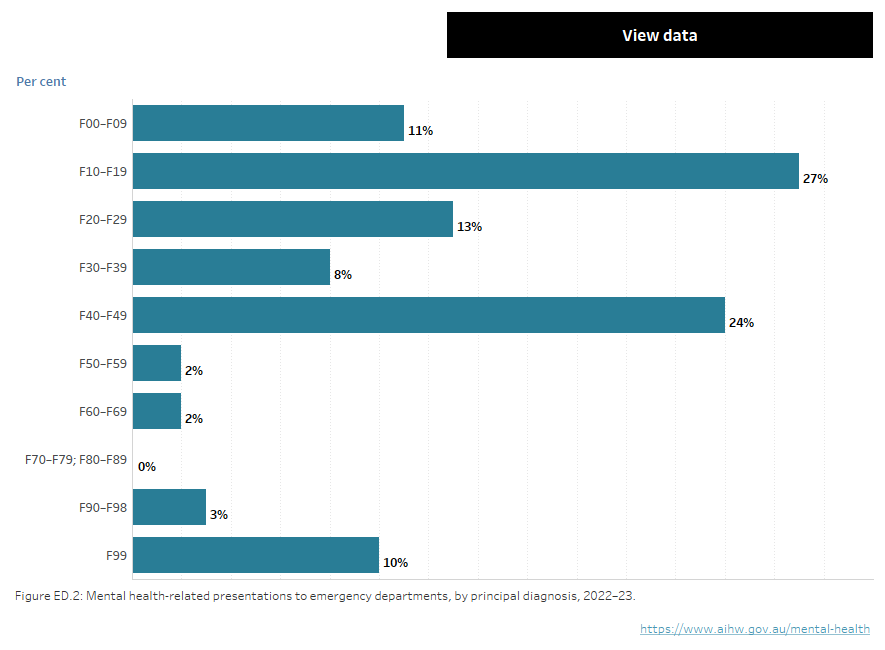
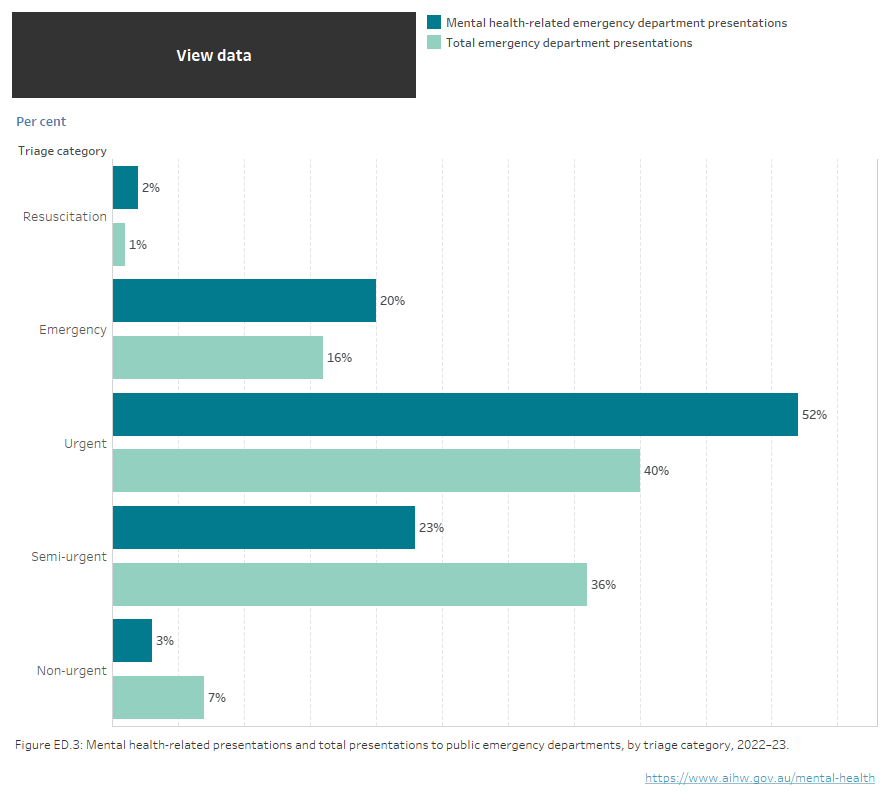
Figure ED.3: horizontal bar chart showing the percentage of mental health-related ED presentations and all ED presentations in public hospitals by triage category. Compared with across all ED presentations, mental health-related ED presentations in 2022–23 had higher proportions of presentations classified as Urgent (52% compared with 40%) Emergency (20% compared with 16%) and Resuscitation (2% compared with 1%), and lower proportions of presentations classed as Semi-urgent (23% compared with 36%) and Non-urgent (3% compared with 7%). Refer to Table NED.1. 

Source: Mental health services provided in emergency departments 2022–23 tables, Table NED.1.

What are the characteristics of emergency department services?

Episode end status

The most frequently recorded episode end status for mental health-related ED presentations was for the patient to depart without being admitted or referred to another hospital, which was recorded for over half of presentations (53%). Over one-third of presentations (37%) resulted in the patient being admitted to the hospital where the emergency service was provided. From 2014–15 to 2022–23, the proportion of presentations ending in admission to the hospital where the emergency service was provided slightly increased from 33% to 37%, while the proportion of presentations where the patient departed without being admitted or referred to another hospital decreased from 61% to 53%.

Where can I find more information?

Key concepts

Key Concept

Description

Emergency department (ED) presentation 

Emergency department (ED) presentation refers to the period of treatment or care between when a patient presents at an ED and when that person is recorded as having physically departed the ED. It includes presentations for patients who do not wait for treatment once registered or triaged in the ED, those who are dead on arrival, and those who are subsequently admitted to hospital or to beds or units in the ED. An individual may have multiple presentations in a year. For further information can be found in the Non-admitted patient emergency department care NMDS 2022-23

Episode end status

The episode end status indicates the status of the patient at the end of the non-admitted patient emergency department service episode. For more information, refer to METEOR identifier 722382.

DVA status

Within the NNAPEDCD, the Department of Veterans' Affairs (DVA) funding indicator is a data item that indicates whether an eligible person’s care is funded by DVA (DVA status). Eligible veterans and war widows/widowers can receive free treatment at any public hospital, former Repatriation Hospitals (RHs) or a Veteran Partnering (VP) contracted private hospital as a private patient in a shared ward, with the doctor of their choice. For more information, refer to METEOR identifier 644877.

Mental health‑related emergency department (ED) presentation 

Mental health‑related emergency department (ED) presentation refers to an ED presentation that has a principal diagnosis that falls within the Mental and behavioural disorders chapter (Chapter 5) of ICD‑10‑AM (codes F00–F99). It should be noted that this definition does not encompass all mental health‑related presentations to EDs, as detailed above. Additional information about this and applicable caveats can be found in the data source section. 

Principal diagnosis 

The principal diagnosis is the diagnosis established at the conclusion of the patient’s attendance in an emergency department to be mainly responsible for occasioning the attendance.

Seen on time

An emergency department presentation is categorised as seen on time when commencement of clinical care was within the time specified in the definition of the triage category.

Socio-Economic Indexes for Areas (SEIFA)

SEIFA is a product developed by the Australian Bureau of Statistics (ABS) that ranks areas in Australia according to relative socio-economic advantage and disadvantage. It consists of 4 indexes based on information from the five-yearly Census of Population and Housing, each being a summary of a different subset of Census variables and focuses on a different aspect of socio-economic advantage and disadvantage. Further details are available from the ABS.

Triage category

The triage category indicates the urgency of the patient’s need for medical and nursing care. It is usually assigned by an experienced registered nurse or medical practitioner at, or shortly after, the time of presentation to the emergency department. The triage category assigned is in response to the question: ‘This patient should wait for medical assessment and treatment no longer than...?’ 

The Australasian Triage Scale has 5 categories that incorporate the time by which the patient should receive care: 

  • Resuscitation: immediate (within seconds) 
  • Emergency: within 10 minutes 
  • Urgent: within 30 minutes 
  • Semi-urgent: within 60 minutes 
  • Non-urgent: within 120 minutes. 

Data coverage includes the time period 2014–15 to 2022–23. This section was last updated in April 2024.