Presentations to emergency departments
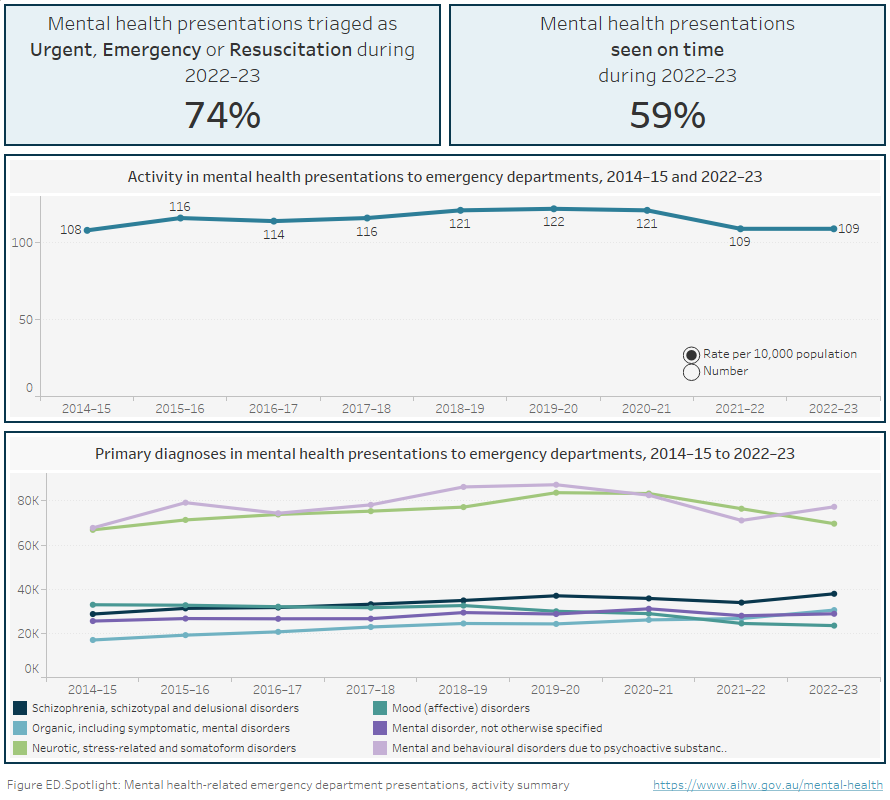
About 287,500 mental health-related presentations

to public emergency departments in 2022–23, which was 3% of all presentations
27% had a principal diagnosis of Mental and behavioural disorders due to psychoactive substance use

making this the most frequent diagnosis
59% seen on time

based on triage status compared with 65% across all ED presentations
Public hospital emergency departments (EDs) play a role in treating mental illness. People seek mental health-related services in EDs for a variety of reasons, often as an initial point of contact or for after-hours care (Morphet et al. 2012).
State and territory health authorities collect a core set of nationally comparable information on most public hospital emergency department (ED) presentations in their jurisdiction, which has been compiled annually into the National Non-Admitted Patient Emergency Department Care Database (NNAPEDCD).
This page currently shows national-level data only; state and territory-level data are available on the proceeding page.
Mental health-related ED presentations in this report are defined as presentations to public hospital EDs that have a principal diagnosis of Mental and behavioural disorders. More details about NNAPEDCD and identifying mental health presentations are available in the data source section.
Spotlight data
Summary of mental health-related presentations to emergency departments activity
Infographic containing: 1) Number and rate (per 10,000) of mental health-related emergency department (ED) presentations from 2014–15 to 2022–23; 2) Primary diagnoses in mental health presentations to EDs from 2014–15 to 2022–23; 3) Percentage of mental health-related ED presentations triaged as Urgent, Emergency or Resuscitation during 2022–23 (74%); and 4) Percentage of mental health-related ED presentations classified as seen on time during 2022–23 (59%).

Source: Mental health-related services presentations to emergency departments 2022–23 tables
Service provision
In 2022–23, there were about 287,500 public hospital ED presentations with a mental health-related principal diagnosis recorded, representing 3% of all ED presentations. This is in line with mental health-related ED presentations as a proportion of all ED presentations since 2014–15, which has ranged between 3% and 4%. Nationally, the rate of mental health-related ED presentations in 2022–23 was 109 per 10,000 population.
Statistic | Number |
|---|---|
Total mental health-related presentations | 287,419 |
Median mental health-related presentations per day | 788 |
Number of mental health-related presentations on busiest day | 1,071 |
Date of busiest day | 01 Jan 2023 |
Who presents to emergency departments?
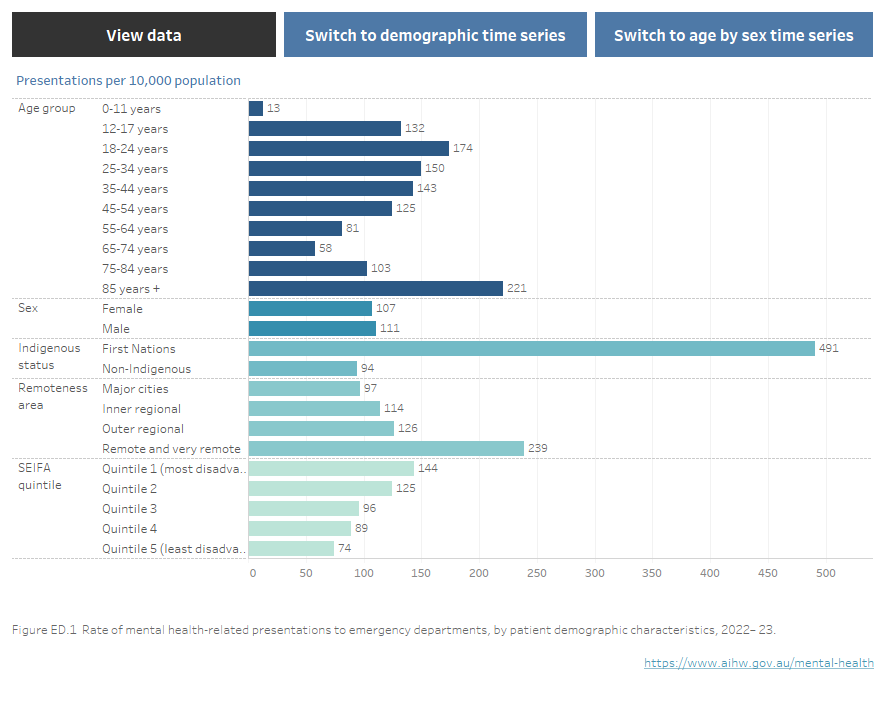
Rates of mental health-related emergency department presentations vary by age and sex. In 2022–23, among women, the highest rate was for those aged 85 years and over (212 per 10,000 population), followed by 18–24 years (199) and 12–17 years (186). Among men, the highest rate was also for those aged 85 years and over (234) followed by 35–44 years (163) and 25–34 years (160) (Figure ED.1.2). These differences are likely to be influenced by differences in prevalence and age of onset of different mental disorders (WHO 2019).
Between 2014–15 to 2022–23, while most age groups among women had relatively stable rates of presentation, those aged 18–24 years and 12–17 years peaked in 2020–21, before returning to the long-term trend (Figure ED.1.1).
Since 2014–15, patterns of rates within age groups for both women and men presenting to ED have been largely stable over time (Figure ED.1.2).
Nationally, in 2022–23 males had a slightly higher rate of mental-health related emergency department presentations than females (111 presentations per 10,000 population compared with 107). Females have had a higher rate of presentations compared with males almost every year since 2014–15 (Figure ED.1.2).
Aboriginal and Torres Strait Islander (First Nations) people are proportionally overrepresented in terms of mental health-related ED presentations, making up about 3% of the Australian population (ABS 2022) but accounting for 14% of presentations. The age-standardised rate of mental health-related ED presentations for First Nations Australians in 2022–23 was more than 5 times that of non-Indigenous Australians (496 per 10,000 population compared with 98; Figure ED.1). For First Nations Australians this rate has also increased by almost 50% over the past 9 years (from 338 to 496), whereas for non-Indigenous Australians, it has remained comparatively stable (Figure ED.1.2).
In 2022–23, people living in Remote and Very remote areas had the highest rate of mental health-related ED presentations at 239 people per 10,000 population. This is more than double the rate for people in Major cities, who had the lowest rate of 97 (Figure ED.1.2). Since 2014–15, the rate of mental health-related ED presentations among people living in Remote and Very remote areas has increased by 85% (from 129 to 239). People living in Remote and Very remote areas have consistently had the highest rate of mental health-related ED presentations over this time and people living in Major cities have consistently had the lowest (Figure ED.1.2).
Rates of mental health-related ED presentations for SEIFA Quintile 1 (most disadvantaged) in 2022–23 were double that for Quintile 5 (least disadvantaged) with 144 presentations per 10,000 population compared with 74 (Figure ED.1). While data by SEIFA quintiles between 2014–15 and 2022–23 show rates have been largely stable within individual quintiles, they also show that mental health-related ED presentations increase as socio-economic disadvantage increases (Figure ED1.2).
Figure ED.1: Mental health-related ED presentations, by patient demographic characteristics, 2022–23
Figure ED.1 Horizontal bar chart showing the rate (per 10,000 population specific) of mental health-related emergency department presentations in public hospitals by patient demographics in 2022–23. Patients 85 years and over had the highest rate of mental health-related ED presentations at 221, followed by 18–24 years (174), 25–34 (150), 35–44 (143), 12–17 (132), 45–54 (125), 75–84 (103), 55–64 (81), 65–74 (58), and 0–11 (13). Males presented at a slightly higher rate than females (111 and 107 respectively). First Nations Australians presented at a higher age-standardised rate than non-Indigenous Australians (496 and 98 respectively). The rate increased with increasing remoteness of remoteness area of usual residence: 97 per 10,000 in Major cities, 114 in Inner regional areas, 126 in Outer regional areas and 239 in Remote and Very remote areas. Mental health-related presentations increased with increasing social disadvantage with 144 presentations per 10,000 for the most disadvantaged quintile (Quintile 1), followed by 125 (Quintile 2), 96 (Quintile 3), 89 (Quintile 4) and 74 for the least disadvantaged quintile (Quintile 5). Refer to Table ED.4.
Figure ED.1.1 Line chart of rate of mental health-related emergency department presentations (per 10,000 population) for age group by sex, 2014–15 to 2022–23. Refer to Table ED.4.
Figure ED.1.2 Line chart of mental health-related emergency department presentations (per 10,000 population) by demographic characteristics, 2014–15 to 2022–23. Refer to Table ED.4.

Note: Rates within the Indigenous status category have been age standardised.
Source: Mental health-related presentations to emergency departments 2022–23 tables, Table ED.4
Department of Veterans’ Affairs
Men who have ever served in the Australian Defence Forces are more likely to report a mental or behavioural condition compared to those who have never served (27% compared with 17%; AIHW 2024). In 2022–23, a total of 1,435 mental health-related ED presentations had a DVA status of ‘Yes’, meaning the patients’ care was funded by the Department of Veterans’ Affairs (DVA). This represents less than 1% of all mental health-related ED presentations. Of the ED presentations for which the care was funded by DVA, 3% were mental health-related presentations.
DVA Status | Number | Per cent |
|---|---|---|
Yes | 1,435 | <1% |
No | 284,341 | 99% |
Total | 287,419 | 100% |
Principal diagnosis
Diagnostic information on mental health-related ED presentations is based on the broad categories within the Mental and behavioural disorders chapter of the ICD‑10‑AM (Chapter 5). More details on diagnosis codes can be found in the data source section.
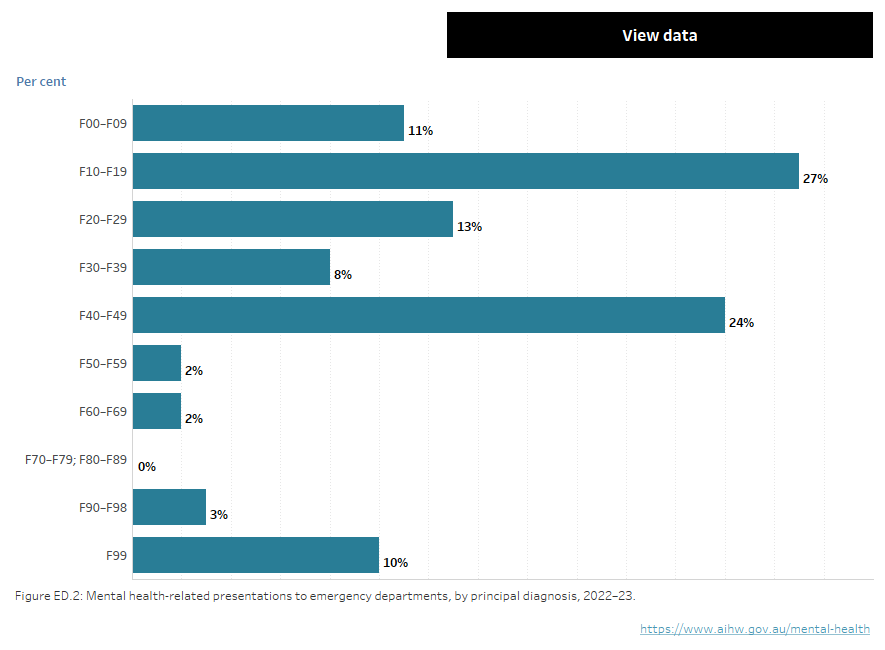
Three quarters (75%) of mental health-related ED presentations in Australian public EDs were classified by 4 principal diagnosis groupings in 2022–23 (Figure ED.2):
- Mental and behavioural disorders due to psychoactive substance use (F10–F19) (27%)
- Neurotic, stress-related and somatoform disorders (F40–F49) (24%)
- Schizophrenia, schizotypal and delusional disorders (F20–F29) (13%)
- Organic, including symptomatic mental disorders (F00–09) (11%).
Figure ED.2: Mental health-related ED presentations, by principal diagnosis, 2022–23
Figure ED.2: Horizontal bar chart showing mental health-related emergency department presentations in public hospitals by principal diagnosis in 2022–23. The majority of presentations were for Mental and behavioural disorders due to psychoactive substance use, making up 27% of presentations, followed by Neurotic, stress-related and somatoform disorders, 24%, Schizophrenia, schizotypal and delusional disorders, 13%; Organic, including symptomatic, mental disorders, 11%; Mental disorder, not otherwise specified 10%; Mood (affective) disorders 8%; Behavioural and emotional disorders with onset usually occurring in childhood and adolescence, 3%; Disorders of adult personality and behaviour, 2%; Behavioural syndromes associated with physiological disturbances and physical factors, 2%; and Disorders of psychological development and Mental retardation (reported as combined categories due to low numbers) >1%.

Key
F00–09: Organic, including symptomatic, mental disorders
F10–19: Mental and behavioural disorders due to psychoactive substance use
F20–29: Schizophrenia, schizotypal and delusional disorders
F30–39: Mood (affective) disorders
F40–49: Neurotic, stress-related and somatoform disorders
F50–59: Behavioural syndromes associated with physiological disturbances and physical factors
F60–69: Disorders of adult personality and behaviour
F70–79; F80–89: Mental retardation; Disorders of psychological development
F90–98: Behavioural and emotional disorders with onset usually occurring in childhood and adolescence
F99: Mental disorder, not otherwise specified
Note: ICD-10-AM codes F70-F79 (Mental retardation) and F80-F89 (Disorders of psychological development) are reported as one category due to small numbers. The grouping is not related to characteristics of the conditions.
Source: Mental health-related presentations to emergency departments, 2022-23 tables, Table NED.5
The arrival mode records the way in which a person arrives at the ED. Nationally, just over half of mental health-related ED presentations in 2022–23 arrived via ambulance, air ambulance or helicopter rescue service (52%), which is double the proportion for all ED presentations (26%). About 8% arrived by police or correctional service vehicles, whereas about 1% arrived by this mode across all ED presentations.
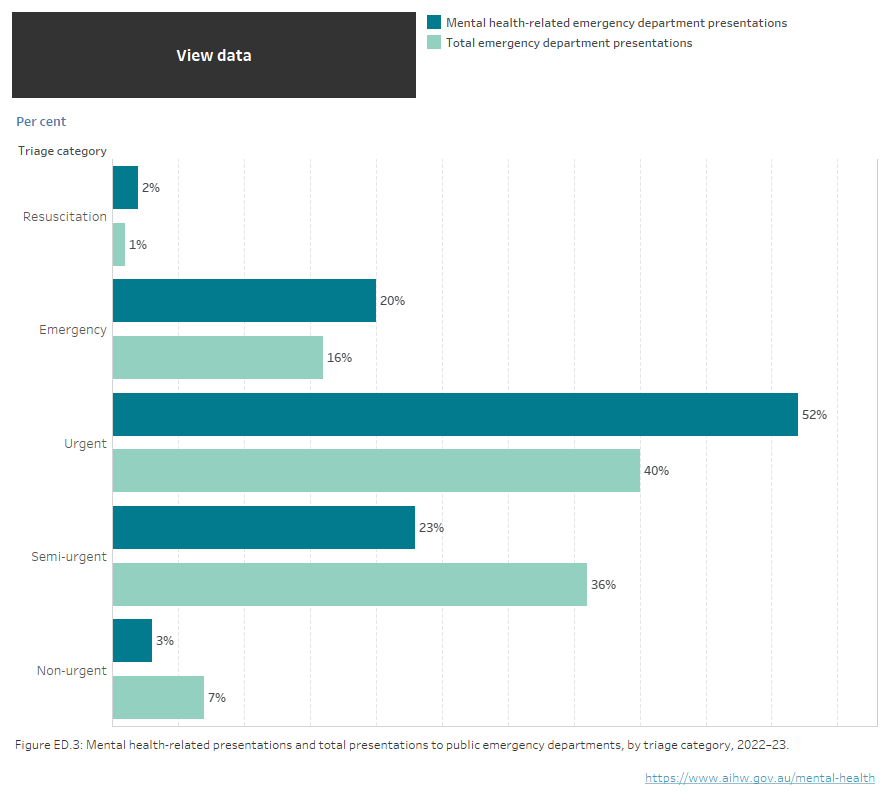
When presenting to an ED, patients are clinically assessed to determine their priority for care (triaged) and an appropriate triage category is assigned. For example, patients triaged as Emergency category require care within 10 minutes (ACEM 2013). However, due to a range of factors, care may or may not be received within the designated time frames. Compared with across all ED presentations, mental health-related ED presentations in 2022–23 had higher proportions of presentations classified as Urgent (52% compared with 40%) Emergency (20% compared with 16%) and Resuscitation (2% compared with 1%), and lower proportions of presentations classed as Semi-urgent (23% compared with 36%) and Non-urgent (3% compared with 7%) (Figure ED.3).
Figure ED.3: Mental health-related presentations and total presentations to public EDs, by triage category, 2022–23
Figure ED.3: horizontal bar chart showing the percentage of mental health-related ED presentations and all ED presentations in public hospitals by triage category. Compared with across all ED presentations, mental health-related ED presentations in 2022–23 had higher proportions of presentations classified as Urgent (52% compared with 40%) Emergency (20% compared with 16%) and Resuscitation (2% compared with 1%), and lower proportions of presentations classed as Semi-urgent (23% compared with 36%) and Non-urgent (3% compared with 7%). Refer to Table NED.1.

Source: Mental health services provided in emergency departments 2022–23 tables, Table NED.1.
Waiting time is the time from presentation to clinical care commencement. The median waiting time to be seen for mental health-related ED presentations in 2022–23 was 22 minutes, with 59% of presentations seen on time according to their triage category, compared to 65% across all ED presentations (AIHW 2023). Ten per cent of mental health-related presentations had a waiting time longer than 2h:26min.
Length of emergency department stay refers to the elapsed time from presentation to physical departure from the ED. Nationally, in 2022–23 the median length of stay for all mental health-related ED presentations was 4h:55m. Ten per cent of presentations had a length of stay longer than 18h:09m, longer than the same measure for across all ED presentations (10h:32m) (AIHW 2023).
Episode end status
The most frequently recorded episode end status for mental health-related ED presentations was for the patient to depart without being admitted or referred to another hospital, which was recorded for over half of presentations (53%). Over one-third of presentations (37%) resulted in the patient being admitted to the hospital where the emergency service was provided. From 2014–15 to 2022–23, the proportion of presentations ending in admission to the hospital where the emergency service was provided slightly increased from 33% to 37%, while the proportion of presentations where the patient departed without being admitted or referred to another hospital decreased from 61% to 53%.
Where can I find more information?
National Non-Admitted Patient Emergency Department Care Database
All state and territory health authorities collect a core set of nationally comparable information on emergency department (ED) presentations (including mental health-related ED presentations) in public hospitals within their jurisdiction. The AIHW compiles this data annually to form the National Non-Admitted Patient Emergency Department Care Database (NNAPEDCD). In 2022–23, 293 of Australia’s public hospital emergency departments reported emergency department presentations to the NNAPEDCD (AIHW 2023a).
Prior to 2014–15, diagnosis-related information was not included in the NNAPEDCD and states and territories provided the AIHW with a bespoke analysis of mental health-related ED presentations. Diagnosis-related data has subsequently been included in the NNAPEDCD. In this report, data from 2014–15 to 2022–23 are sourced from the NNAPEDCD.
Definition of mental health-related emergency department presentations
Mental health-related ED presentations in this report are defined as presentations in public hospital EDs that have a principal diagnosis of Mental and behavioural disorders (that is, codes F00–F99) in ICD-10-AM or the equivalent codes in other coding schemas. It does not include codes for self-harm or poisoning.
For 2022–23, principal diagnoses information is reported for the NNAPEDCD using ICD-10-AM (11th Ed)Principal Diagnosis Short List, developed by the Independent Health and Aged Care Hospital Pricing Authority (IHACPA) from the full version of ICD-10-AM. Further information is available in Emergency department care 2022–23 Appendixes (AIHW 2023a).
The Mental and behavioural disorders principal diagnosis codes may not fully capture all mental health-related presentations to EDs, such as presentations for self-harm. Diagnosis codes for intentional self-harm are not part of the Mental and behavioural disorders chapter and are not in-scope for the principal diagnosis variable for the NNAPEDCD. Additionally, a presentation for self-harm may have a principal diagnosis relating to the injury, for example Open wound to wrist and hand. These presentations cannot be identified as mental health-related presentations in the NNAPEDCD and are not included in this report.
Further information on the NNAPEDCD is available on METEOR, the AIHW’s Metadata Online Registry.
Response to COVID-19
From February 2020, Australian governments introduced a range of restrictions on travel, business, social interaction and border control in response to the COVID-19 pandemic. From October 2020, Australia was at the end of the second wave of the pandemic, leading to relaxation of those restrictions. Over the pandemic period to present, the total number of ED presentations and mental health-related ED presentations have been impacted by a range of factors which may have influenced an individual seeking mental health care or other care in the ED setting. These include changes to the accessibility of mental health care through general practice with the introduction of telehealth and increases in the number of Medicare-subsidised services which could be delivered by psychologists. ED presentations in 2020–21 increased by 7% from 2019–20 and remained stable in both 2021–22 and 2022–23 (AIHW 2023). In contrast, the number of mental health-related ED presentations increased in 2019–20 but decreased in both 2020–21 and 2021–22.
ABS (Australian Bureau of Statistics) (2022) Census of Population and Housing – Counts of Aboriginal and Torres Strait Islander Australians 2021, ABS, accessed 18 April 2023.
ABS (n.d.). Statistical geography explained, ABS, accessed 28 May 2023.
ACEM (Australasian College for Emergency Medicine) (2013). Policy on the Australasian Triage Scale (P06), ACEM, accessed February 2024.
AIHW (Australian Institute of Health and Welfare) (2023) Emergency department care, AIHW, accessed 15 February 2024.
AIHW (Australian Institute of Health and Welfare) (2023a). Hospitals info & downloads: About the data, AIHW, accessed 15 February 2024.
AIHW (2024) Health of veterans: Health status, AIHW, accessed 15 February 2024.
Morphet J, Innes K, Munro I, O'Brien A, Gaskin CJ, Reed F, Kudinoff T (2012) 'Managing people with mental health presentations in emergency departments – a service exploration of the issues surrounding responsiveness from a mental health care consumer and carer perspective', Australasian Emergency Nursing Journal 15:148-55, doi: 10.1016/j.aenj.2012.05.003.
World Health Organization (WHO) (2019) Adolescent mental health, WHO, accessed 6 May 2022.
Amendments
23 Aug 2024
- Time series data for First Nations status age-standardised rates have been corrected due to historical over-inflation of the population denominators used to calculate these rates.
- For all demographic categories except Age group, rates of ED presentations in the “View Data” table visualisation associated with Figure ED.1.2 were previously incorrect and have been amended. Note that this correction is not applicable to the Figure ED.1.2 line charts nor the main Excel downloads for the Mental health presentations to emergency departments report.
Data coverage includes the time period 2014–15 to 2022–23. This section was last updated in July 2024.


