Hospitals play an important role in Australia’s health care system, providing care to millions of Australians each year. Services are provided both to admitted patients and non-admitted patients (through outpatient clinics and emergency departments). 

Australia has public and private hospitals. Public hospitals are largely owned and managed by state and territory governments, with funding also provided by the Australian Government. Private hospitals are owned and managed by private organisations, some of which are non-profit. Private hospitals are funded by charges to patients that are often subsidised by government and private health insurance payments.

Overview

On average per day, Australian hospitals:

in 2021–22:

  • employ 181,000 nurses and 54,000 doctors in public hospitals
  • cost $263 million to run public and private hospitals

in 2022–23:

  • record 33,200 hospitalisations in public and private hospitals 
  • record 410 hospitalisations with a hospital-acquired complication in public and private hospitals
  • provide 113,000 services to non-admitted patients 
  • record 5 Staphylococcus aureus bloodstream infections in public hospitals
  • treat 24,100 people in emergency departments at public hospitals
  • record 2,000 admissions to public hospitals from elective surgery waiting lists 

Source: HEA 2021–22, NPHED 2021–22, NHMD 2022–23, NNAPEDCD 2022–23, NESWTD 2022–23, NNAPCD 2022–23, NSABDC 2022–23.

Spending on hospitals

Public and private hospitals are funded from sources including the Australian Government, state and territory governments, private health insurance funds and out-of-pocket payments by individuals. Hospitals vary in the types of services they provide, the patients they treat, funding sources, and other factors.

How much is spent on hospital care?

In 2021–22, $96.0 billion ($3,725 per person) was spent on hospital care in Australia (AIHW 2023). Individual spending per person on hospital care increased by an average of 0.3% per year between 2016–17 and 2021–22, after adjusting for inflation. 

The $96.0 billion spent on hospitals in 2021–22 accounted for 40% of all health expenditure ($241.3 billion) and is comprised of an estimated:

  • $43.8 billion (46%) from state and territory governments
  • $34.9 billion (36%) from the Australian Government
  • $17.2 billion (18%) from non-government sources (Figure 1).

Figure 1: Expenditure ($ billion) on public and private hospitals, by source of funds, constant prices, 2012–13 to 2021–22

The line chart shows that the state and territory governments consistently spent the most on public hospitals whilst non-government entities consistently spent the most on private hospitals.

Public hospitals

In 2021–22, a total of $77.2 billion was spent on public hospitals in Australia by:

  • state and territory governments – $42.6 billion (55%)
  • the Australian Government – $29.9 billion (39%)
  • non-government entities – $4.7 billion (6.1%) (including individuals and private health insurers).

State and territory governments, which have primary responsibility for administering public hospitals, contributed the most funding.

Between 2011–12 and 2021–22, Australian Government expenditure on public hospitals increased 3.8% per year on average and state and territory expenditure increased 4.1% per year on average.

Private hospitals

In 2021–22, an estimated total of $18.8 billion was spent on private hospitals by: 

  • private health insurance providers – $8.9 billion (47%)
  • the Australian Government – $5.1 billion (27%)
  • individuals – $2.2 billion (12%)
  • other non-government – $1.4 billion (7.4%)
  • state and territory governments – $1.2 billion (6.5%).

Sixty-seven per cent ($12.5 billion) of private hospital spending came from the non-government sector.

Between 2011–12 and 2021–22, total funding for private hospitals increased by an average of 2.6% each year. The proportion of funding provided by the Australian Government increased 0.3% and funding from state and territory governments increased, on average, 7.0%.

For more information, see Health expenditure Australia 2021–22.

Australian Government expenditure on hospital care listed in this section excludes Medicare Benefits Schedule (MBS) and some Pharmaceutical Benefits Scheme (PBS) spending that relates to services provided in hospitals and that have not historically been treated as hospital spending.

Hospital workforce

Who works in our hospitals?

The hospital workforce in Australia is large and diverse, covering many occupations including medical officers, nurses, diagnostic and allied health professionals (such as physiotherapists and occupational therapists), administrative and clerical staff, and domestic and other personal care staff.

Public hospitals

In 2021–22, there were 438,500 full-time equivalent (FTE) staff employed in public hospitals. The number of FTE staff has increased 3.8% per year on average since 2017–18.

Table 1: Staff and average salaries, public hospitals, 2021–22
Type of staffAverage number of full-time equivalent staffAverage salary (per year)

Nurses

181,004 (41%)

$115,244

Administrative and clerical staff

83,478 (19%)

$91,232

Diagnostic and allied health professionals

72,912 (17%)

$103,100

Salaried medical officers

53,946 (12%)

$241,168

Domestic and other personal care staff

47,176 (11%)

$74,192

The workforce described here includes people employed to manage and deliver public hospital services in public hospitals themselves, as well as within local hospital networks (LHNs) and state/territory health authorities. These staff numbers do not include visiting medical officers in public hospitals who are generally employed by the hospital on a contractual, rather than salaried basis. 

For more information, see Hospital workforce.

Hospital activity

In 2022–23 there were:

  • 12.1 million hospitalisations (admitted patient care)
  • 8.8 million presentations to emergency departments
  • 735,000 admissions from public hospital elective surgery waiting lists.
  • 41.1 million non-admitted patient (outpatient) services delivered.

Emergency department care activity

How much care do our emergency departments provide? 

In Australia, there are 293 public hospitals that have purpose-built emergency departments that are staffed 24 hours a day and provide care to patients who require urgent medical, surgical, or other attention.

In 2022–23, there were 8.8 million presentations to emergency departments – 334 presentations per 1,000 population. This has increased from 330 presentations per 1,000 population in 2018–19 – an increase of 0.3% a year.

In 2022–23, 70% of presentations occurred between 8 am and 8 pm. The busiest days for emergency department visits were Sundays, Mondays and Tuesdays.

How urgent was the care?

When a patient presents to the emergency department, they are assigned a triage category by a registered nurse or medical practitioner that reflects the urgency of the patient’s need for medical and nursing care (Table 2).

Table 2: Emergency department presentations by triage category, 2022–23
 Resuscitation (should be seen immediately)Emergency (within 10 minutes)Urgent (within 30 minutes)Semi-urgent (within 60 minutes)Non-urgent (within 2 hours)Total

Presentations

77,230

1,431,840

3,557,510

3,135,480

596,140

8,800,919

Proportion of all presentation (%)

0.9%

16.3%

40.4%

35.6%

6.8%

100%

In 2022–23, 26% of patients arrived at the emergency department by ambulance or air rescue service, with the remaining 74% arriving by other forms of transport, including by private car.

Why do people present to emergency departments?

A patient’s diagnosis is established at the end of the patient’s emergency department stay and identifies the main reason for their visit to the emergency department.

In 2022–23, the most common reason for a presentation at an emergency department was for ‘Symptoms, signs, and abnormal findings’ – accounting for 26% of presentations. ‘Symptoms, signs, and abnormal findings’ are symptoms such as abnormalities of heartbeat, abnormalities of breathing, chest pain, nausea and vomiting, headache, and convulsions that are not attributable to a specific diagnosis based on the information available at the time of the care.

The most common diagnoses recorded for emergency department presentations vary by the age of the patient (Figure 2).

Figure 2: Top 3 reasons people present to emergency departments, by ICD-10-AM chapter and age-group, 2022–23

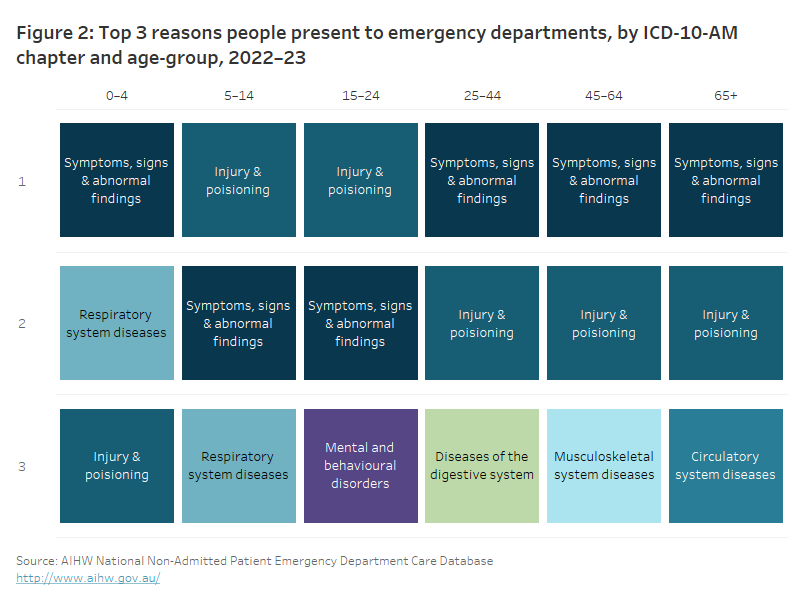
The top reason persons across all age groups present to emergency department is for either ‘Injury and poisoning’ or ‘Symptoms, signs, and abnormal findings’.

For more information, see Emergency department care.

Admitted patient care activity

How many hospitalisations were there?

Admission to hospital is an administrative process that follows a doctor’s decision that a patient needs to be admitted for appropriate management or treatment of their condition, and/or for appropriate care or assessment of their needs. Patients may be admitted and discharged on the same day or may stay in hospital for one or more nights.

In 2022–23, there were 12.1 million hospitalisations (415 per 1,000 population). Public hospitals provided 59% (7.1 million) of hospitalisations and private hospitals provided 41% (5.0 million) (Table 3).

Since 2018–19, hospitalisations have increased from around 11.5 million (6.8 million in public hospitals and 4.6 million in private hospitals). The rate of hospitalisations per 1,000 population over the same period decreased in public hospitals from 254 to 247 per 1,000 population and increased slightly in private hospitals from 167 to 168 per 1,000 population.

Collectively, hospitals provided 33.2 million days of patient care in 2022–23. This was an increase compared with 2018–19 when 30.9 million days of patient care were provided.

Table 3: Characteristics of admitted patient care, public, private and all hospitals, 2022–23


Public hospitals

Private hospitals

All hospitals

Hospitalisations

7.1 million

5.0 million

12.1 million

Medical

5.0 million

1.6 million

6.6 million

General intervention (Surgical)

1.1 million

1.7 million 

2.8 million

Specific intervention (Other)

477,000

1.0 million

1.5 million 

Childbirth

218,000

64,200

282,000

Mental health care

136,000

218,000

354,000

Sub-acute and non-acute care

217,000

383,000

600,000

Same-day versus overnight

56% same-day stays

74% same-day stays 

63% same-day stays

Number of days of patient care

22.8 million (average increase of 2.4% per year since 2018–19)

10.4 million (average increase of 0.7% per year since 2018–19)

33.2 million (average increase of 1.% per year since 2018–19) 

Average length of stay (for overnight stays)

6.0 days

5.1 days

5.7 days

Why do people go to hospital?

People experience different health issues at different times of their lives, so the reasons for hospitalisation vary by age and by sex (Figure 3). For example, in 2022–23:

  • babies and children under 5 were hospitalised most often for Respiratory system diseases, whereas children aged 5–14 were most often hospitalised for digestive system diseases
  • males aged 15–24 were most often hospitalised for diagnoses related to Injury and poisoning, however, females in this age group were most often hospitalised for diagnoses related to Pregnancy, childbirth and the puerperium
  • adults aged 45 and over were most often hospitalised for Other factors influencing health status.

Figure 3: Top 3 reasons for hospitalisation, by ICD-10-AM chapter, sex and age-group, 2022–23

The top reason for hospitalisation for both males and females in the age-groups of 45 to 64 and 65+ was for ‘Other factors influencing health status’. ‘Injury and poisoning’ were the top reason for hospitalisation for males in the age groups 5 to 14 and 15 to 24. ‘Pregnancy, childbirth, and the puerperium’ were the top reason for hospitalisation for females in the age-groups 15 to 24 and 25 to 44.

For more information, see Admitted patients.

Elective surgery activity

How many people are admitted from elective surgery waiting lists?

In 2022–23, 735,000 patients were admitted for surgery from public hospital elective surgery waiting lists – an 18% increase compared with 2021–22, and an average decrease of 0.8% per year since 2018–19.

Figure 4: Admissions from public hospital elective surgery waiting lists, by clinical urgency category and month, 2022–23

Category 3 which are surgeries that need to be performed within 365 days have the lowest number of admissions throughout the entire financial year compared to category 1 (within 30 days) and category 2 (within 90 days) surgeries. Between December 2022 and February 2023, the number of admissions drops significantly for all clinical urgency categories.

For more information, see Elective surgery.

Non-admitted patient activity

How many services are provided in the outpatient setting?

Every year many Australians receive services via ‘outpatient’ or non-admitted patient clinics. These services are often associated with an emergency or admitted patient episode for which diagnostic or follow-up care is required without needing the person to be admitted to hospital.

In 2022–23, 41.1 million non-admitted patient care service events were provided for public patients..

This comprised of:

  • 19.6 million (48%) services provided in Allied health and/or clinical nurse specialist intervention clinics, which provide services by an allied health professional or clinical nurse specialist
  • 12.8 million (31%) services provided in Medical consultation clinics, which provide services by a medical or nurse practitioner and may include input from allied health personnel and/or clinical nurse specialists
  • 5.3 million (13%) services in Diagnostic service clinics, which provide imaging, screening, clinical measurement and pathology
  • 3.3 million (8%) services in Procedural clinics, which provide minor surgical and non-surgical procedures (that do not require the patient to be admitted) by a surgeon or other medical specialist.

For more information, see Non-admitted patients.

Hospital safety and quality

Regulatory systems and arrangements to ensure the safety and quality of hospital services in Australia include those for:

  • medicines and devices
  • health facilities
  • the health workforce
  • clinical standards and guidelines
  • clinical governance arrangements.

Monitoring and improvement of care quality for particular illnesses and procedures also occurs, for example, through research projects, clinical quality registers and routinely collected health system data, such as the AIHW’s National Hospital Morbidity Database (NHMD). Patient experience surveys can also provide an indication of the quality of care provided from the patient’s perspective.

Hospital safety and quality measures reported include:

  • Staphylococcus aureus blood stream infections (SABSI) acquired in hospital
  • hospital-acquired complications such as birth trauma
  • patient experience survey results.

Staphylococcus aureus bloodstream infections

Staphylococcus aureus (also S. aureus, or ‘Golden staph’) is a type of bacteria that can cause bloodstream infection.

SABSI can be acquired after a patient receives medical care or treatment in a hospital. Contracting a Staph. aureus bloodstream infection while in hospital can be life-threatening and hospitals aim to have as few cases as possible. The nationally agreed benchmark for healthcare-associated Staphylococcus aureus bloodstream infections is no more than 1 case of healthcare-associated SABSI per 10,000 days of patient care for public hospitals in each state and territory.

In 2022–23, there were 1,668 SABSI cases occurring during 22.5 million days of patient care under surveillance. This represents a rate of 0.74 SABSI cases per 10,000 patient days.

Most SABSI cases (84%) were methicillin-sensitive and therefore treatable with commonly used antimicrobials.

Hospital-acquired complications

A hospital-acquired complication is a complication that arises during a patient’s hospitalisation which may have been preventable, and which can have a severe impact on both the patient and the care required. 

Hospital-acquired complications include pressure injuries, healthcare-associated infections, malnutrition, neonatal birth trauma, cardiac complications, and delirium. They may affect a patient’s recovery, overall outcome and can result in a longer length of stay in hospital. A patient may have one or more hospital-acquired complications during a hospitalisation.

In 2022–23, 115,000 hospitalisations (2.0 per 100 hospitalisations) in public hospitals had at least one hospital-acquired complication, and 34,200 hospitalisations (0.8 per 100 hospitalisations) in private hospitals had at least one hospital-acquired complication.

In 2022–23, the most common hospital-acquired complications were related to:

  • healthcare associated infections (62,400 in public hospitals and 15,000 in private hospitals)
  • delirium (19,600 in public hospitals and 6,300 in private hospitals)
  • cardiac complications (17,200 in public hospitals and 7,300 in private hospitals).

In 2022–23, the average length of stay (ALOS) for overnight hospitalisations with at least one hospital-acquired complication was 21.7 days in public hospitals and 17.1 days in private hospitals, longer than the ALOS without a hospital-acquired complication reported (5.1 days and 4.7 days, respectively) (Figure 5).

Figure 5: Average length of stay (days) for overnight hospitalisations with and without a hospital-acquired complication (HAC), 2022–23

The average length of stay for overnight hospitalisations with a hospital-acquired complication was 21.7 days for public hospitals and 17.1 days for private hospitals. Whilst the average length of stay for overnight hospitalisations without a hospital-acquired complication was 5.1 days for public hospitals and 4.7 days for private hospitals.

What do patients say about their hospital experience?

The Australian Bureau of Statistics (ABS) conducts an annual survey, Patient Experiences, to monitor the experiences of Australians who use a range of healthcare services. People who have received hospital care or emergency department care are asked about their experiences with health professionals (ABS 2022).

Emergency department

Among people who attended an emergency department in 2022–23: 

  • 82% of patients responded that emergency department doctors ‘always’ or ‘often’ listened carefully to them.
  • 85% of patients responded that emergency department doctors ‘always’ or ‘often’ showed respect.
  • 77% of patients responded that emergency department doctors ‘always’ or ‘often’ spent enough time with them. 
  • 87% of patients responded that emergency department nurses ‘always’ or ‘often’ listened carefully to them.
  • 89% of patients responded that emergency department nurses ‘always’ or ‘often’ showed respect.
  • 82% of patients responded that emergency department nurses ‘always’ or ‘often’ spent enough time with them in the emergency department. 

Admitted patients

Among people who received hospital care in 2022–23:

  • 91% of patients responded that hospital doctors ‘always’ or ‘often’ listened carefully to them.
  • 92% of patients responded that hospital doctors ‘always’ or ‘often’ showed respect.
  • 86% of patients responded that hospital doctors ‘always’ or ‘often’ spent enough time with them.
  • 92% of patients responded that hospital nurses ‘always’ or ‘often’ listened carefully to them.
  • 93% of patients responded that hospital nurses ‘always’ or ‘often’ showed respect.
  • 88% of patients responded that hospital nurses ‘always’ or ‘often’ spent enough time with them.

For more information see:

Access to hospitals

Providing access to appropriate and timely hospital care is an integral component of health care. In essence, it is about being able to get the health care you need, when you need it. 

A person’s ability to access appropriate and quality health care is influenced by their own health needs as well as factors such as where they live, their socioeconomic circumstances, and their cultural background (WHO 2006).

This section explores hospital accessibility by looking at the:

  • number of services available, including hospitals and emergency departments
  • location of services and hospitals
  • waiting times to access elective surgery and emergency department care
  • remoteness, socioeconomic characteristics and Indigenous status of the people who use hospital services.

Where are hospitals and beds located?

The number and type of hospitals, and the beds available, are measures of access to health care services. Public hospitals in Major cities are more likely to be larger and to offer a broader range of services, whereas hospitals in more remote areas tend to be smaller and offer fewer services. This can affect the timeliness and availability of services for people living in more remote areas.

In 2021–22, there were 697 public hospitals which varied in location, size, and services provided. Of these public hospitals, 185 were in Major cities, 401 were in Inner regional and Outer regional areas, and 111 were in Remote or Very remote areas.

There were 63,400 public hospital beds available, on average, in 2021–22 – representing 2.5 beds per 1,000 population. This ranged from 2.3 per 1,000 population in Major cities to 3.9 per 1,000 population in Remote and Very remote areas.

Since 2017–18, the number of beds per 1,000 population in public hospitals has fallen by an average of 0.6% every year.

A majority of larger public hospitals and therefore a majority of hospital beds are located in more populated areas – 27% of hospitals and 67% of hospital beds are located in Major cities, 58% of hospitals and 30% of hospital beds are in Inner regional and Outer regional areas, and 16% of hospitals and 3.1% of hospital beds in Remote and very remote areas.

Access to admitted patient care

In 2022–23, hospitalisation rates varied across socioeconomic levels and remoteness for public and private hospitals.

Patterns of hospitalisations varied by socioeconomic levels – when the level of disadvantage increases, hospitalisations in public hospitals generally increased, while hospitalisations in private hospitals decreased.

For public hospitals, the highest rates of hospitalisation were for patients living in the highest socioeconomic areas (329 hospitalisations per 1,000 population) whereas for private hospitals, the highest rates were for patients living in the lowest socioeconomic areas (235 hospitalisations per 1,000 population).

Patterns of hospitalisations varied by remoteness area – hospitalisations in public hospitals increase with increasing remoteness of the patient’s area of residence, while hospitalisations in private hospitals generally decreased with increasing remoteness of the patient’s area of residence.

The highest rates of hospitalisation in private hospitals were for patients whose area of residence was in Major cities (183 hospitalisations per 1,000 population), whereas the highest rates of hospitalisations in public hospitals were for patients whose area of residence was in Very remote areas (678 hospitalisations per 1,000 population) (Figure 6).

Figure 6: Hospitalisations per 1,000 population by socioeconomic area and remoteness, 2022–23

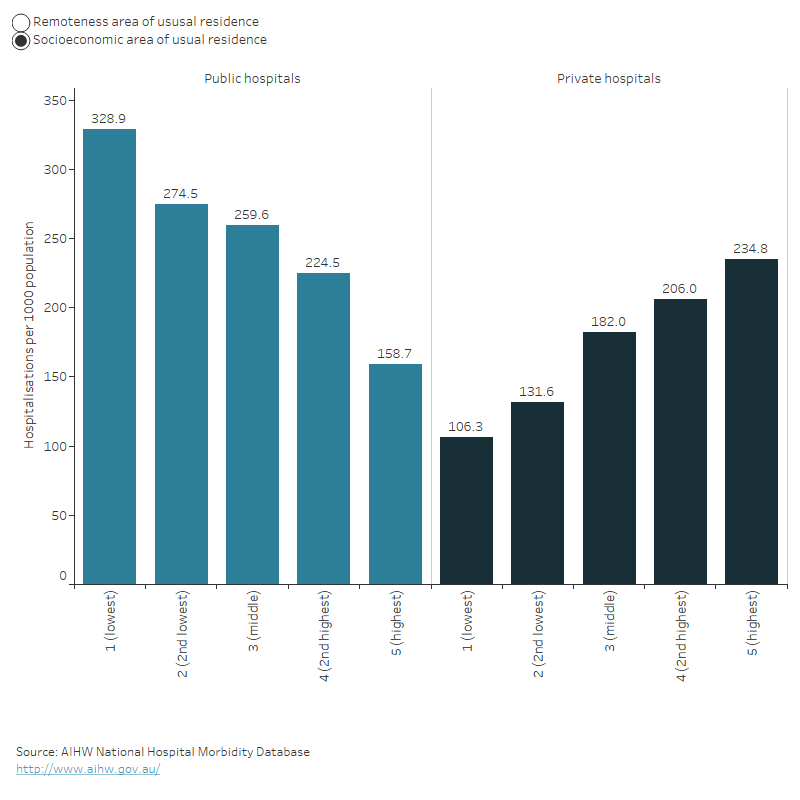
Generally, the number of hospitalisations per 1000 population decreased for public hospitals and increased for private hospitals as the level of disadvantage decreases. Also, the number of hospitalisations per 1000 population generally increased for public hospitals and decreased for private hospitals as the level of remoteness increases.

For more information, see Admitted patient access.

Access to emergency department care

Waiting times

How long people wait in the emergency department before they receive care (waiting time) can be used as a measure of the accessibility of emergency department care.

Waiting time statistics are presented here as:

  • the 50th percentile (median) waiting time, which represents the time within which half of all people are seen
  • proportion ‘seen on time’ for their triage category.

Emergency department waiting time measures represent the time elapsed from presentation to commencement of clinical care (Figure 7).

Figure 7: Time spent in emergency department

The diagram shows stages of presentation, triage, start and end of clinical care and physical departure.

Note: the length of the segments is illustrative only.

Across all emergency presentations to emergency departments in 2022–23, 50% of patients were seen within 20 minutes.

The median waiting time has stayed relatively consistent since 2018–19, when 50% of patients were seen within 19 minutes.

In 2022–23, 65% of presentations to emergency departments were ‘seen on time’.

The proportion of patients seen on time for their triage category has declined slightly since 2021–22 when 67% of patients were seen on time. In 2022–23, the percentage of patients who were seen on time ranged from 100% of patients requiring immediate care (Resuscitation) to 58% of patients who needed care within 30 minutes (Urgent).

In 2022–23, 50% of emergency department presentations were completed within 3 hours and 39 minutes, and 90% were completed within 10 hours and 32 minutes.

For patients who were not subsequently admitted to hospital, 90% completed their care within 7 hours and 19 minutes, but for patients subsequently admitted to hospital, 90% completed their care within 18 hours and 23 minutes.

The time spent in the emergency department for 90% of patients also varied by triage category – ranging from 4 hours and 54 minutes for patients who needed care within 120 minutes (Non-urgent) to 15 hours and 30 minutes for patients requiring immediate care (Resuscitation).

For more information, see Emergency department care access.

Access to surgery

People can be admitted to hospital for emergency surgery, or for less urgent procedures they can be booked in as part of an ‘elective’ (or planned) admission to hospital (elective in this context refers to there being some flexibility around the timing of the procedure, not whether the procedure itself is optional).

Access to surgical services can be affected by issues such as the person’s geographical location, the availability of other healthcare services, and how many people are on public hospital elective surgery waiting lists.

Emergency hospitalisations involving surgery

In 2022–23:

  • 382,000 hospitalisations were emergency admissions that involved surgery
  • 87% (332,000) were in public hospitals and 13% (49,500) were in private hospitals
  • the 3 most common reasons for emergency admissions involving surgery were appendicitis, fractured femur, and heart attack
  • people living in Very remote areas were twice as likely to have an emergency admission involving surgery as people living in Major cities (26 compared with 13 hospitalisations per 1,000 population).

Elective hospitalisations involving surgery

In 2022–23:

  • 2.5 million hospitalisations were elective admissions involved surgery
  • 68% (1.7 million) were in private hospitals and 32% (785,000) were in public hospitals
  • the 3 most common reasons for elective admissions involving surgery were cataracts, skin cancer and procreative management
  • People living in Major cities were nearly one and a half times as likely to have an elective admission involving surgery as people living in Very remote areas (85 compared with 55 hospitalisations per 1,000 population).

Admissions from public hospital elective surgery waiting lists

In 2022–23, 735,000 patients were admitted for elective surgery from public hospital waiting lists.

Removal of cataracts was the most common procedure (10.3%), followed by Cystoscopy (7.5%). The most common surgical specialty was General surgery (20.3%), followed by Urological surgery (14.6%) and Ophthalmology surgery (13.9%).

For the 25 most common intended procedures in 2022–23, people living in Remote areas had the highest rate of admissions from public hospital elective surgery waiting lists (30 hospitalisations per 1,000 population) followed by people in Inner regional  and Outer regional areas (28.3 and 28.2 hospitalisations per 1,000 population respectively). People living in Major cities had the lowest rate of admissions from public hospital elective surgery waiting lists (22 hospitalisations per 1,000 population).

Waiting times for admission to elective surgery

In 2022–23:

  • 50% of patients admitted to hospital from public hospital elective surgery waiting lists waited for 49 days or less, and 90% waited for 361 days or less
  • 9.6% of people admitted for surgery waited more than 365 days compared to 6.3% just a year before
  • 50% of Aboriginal and Torres Strait Islander (First Nations) people were admitted to hospital within 56 days, compared with 50% of non-Indigenous Australians being admitted within 49 days
  • the time within which 50% of patients were admitted for their awaited procedure ranged 41 days in Remote areas to 51 days in Outer regional areas for the 25 most common intended procedures
  • the time within which 50% of patients were admitted ranged from 31 days for patients living in the highest socioeconomic areas to 14 days for people living in the lowest socioeconomic areas socioeconomic areas for the 25 most common intended procedures.

The 50th percentile waiting time increased from 41 days in 2018–19 to 49 days in 2022–23. The 90th percentile waiting time increased from 279 days in 2018–19 to 361 days in 2022–23.

For more information, see Elective surgery access.

Impact of COVID-19 on hospital care

The COVID-19 pandemic has had an ongoing impact on emergency department, admitted patient and elective surgery activity since its emergence in Australia at the start of 2020. 

Impact of COVID-19 on emergency department activity

Emergency department activity in 2019–20, 2020–21 and 2021–22 was influenced by COVID-19 restrictions and the changes affecting health care provision commencing in February 2020. Also, during 2020–21, some jurisdictions operated COVID-19 fever clinics within emergency departments. Comparatively large increases in emergency department activity observed between 2019–20 and 2020–21 in some jurisdictions may be driven, in part, by this additional activity.

Compared with 2018–19, in 2019–20 the number of emergency department presentations decreased by 1.4% – in contrast to the 4.2% increase seen between 2017–18 and 2018–19. In the following year (2020–21) the number of presentations increased by 6.9% – from 8.23 million in 2019–20 to 8.81 million in 2020–21. In 2021–22, the number of presentations decreased by 0.2% to 8.79 million compared with the previous year. Emergency department presentations between 2021–22 and 2022–23, remained relatively stable, increasing by 0.1% overall. 

For more information on the impacts of COVID-19 on emergency department activity from 2019–20 to 2022–23, see Emergency department care activity.

Impact of COVID-19 on admitted patient activity

Australia’s hospital system has played a significant role in managing and treating people with COVID-19. Between January 2020 and June in 2023, there were over 454,000 hospitalisations involving a COVID-19 diagnosis (183,400 in 2021–22).

Before the COVID-19 pandemic, there was an upward trend in national hospital admissions, with an average annual increase of 3.3% from 2014–15 to 2018–19. The onset of the pandemic and the ensuing preventative measures resulted in a decrease in hospitalisations in 2019–20 and 2021–22 compared to the respective preceding years. However, in 2022–23, hospitalisations rebounded, showing a 4.6% increase from the previous year, rising from 11.6 million to 12.1 million.

For more information about the impact of COVID-19 on hospital activity and hospitalisations involving COVID-19, see Admitted patient activity.

Impact of COVID-19 on elective surgery activity

As a result of the restrictions on elective surgery introduced in early 2020, overall, there was an 8.3% decrease in elective admissions involving surgery in public hospitals and a 5.7% decrease in private hospitals between 2018–19 and 2019–20.

In addition, there was a 9.2% decrease in admissions from elective surgery waiting lists between 2018–19 and 2019–20.

Delays to elective surgery resulted in a subsequent increase in waiting times for most intended procedures between 2019–20 and 2020–21. The greatest increases in median waiting times occurred for Tonsillectomy (123 day increase over 2019–20), Varicose vein treatment (94 day increase over 2019–20) and Total knee replacement (85 day increase over 2019–20).

The proportion of patients waiting more than 365 days for their elective surgery also increased between 2019–20 and 2020–21 from 2.8% to 7.6% with the greatest increase for Total knee replacement (11% to 32%) and Septoplasty (18% to 36%).

Although, the median waiting times increased in 2022–23, it has decreased for n Cataract extraction (25 days) – from 158 days in 2021–22 to 133 days in 2022–23.

For more information about the impact of COVID-19 on public hospital elective surgery activity, see Elective surgery activity.

Where do I go for more information?

For more information on Australia's hospitals go to MyHospitals.

Archived content