Chapter 2 Australia's health system
2.0 Introduction
Australia's health system is a multifaceted network of services and settings, involving a variety of public and private providers, funding arrangements, participants and regulatory mechanisms.
This chapter looks at how much money is spent on the health system; where the funding comes from; and who works in the sector. It also provides a broad overview of how the system works.
The governance, coordination and regulation of Australia's health services are complex, and are the joint responsibilities of all levels of government. Planning and delivery of services are shared between the government (public) and non-government (private) sectors.
Public-sector health services are provided by the Australian, state and territory and local governments. Private-sector health service providers include private hospitals and medical practitioners in private practices.
In 2013–14, health spending in Australia was estimated at $155 billion—more than two-thirds of which came from governments. While health expenditure has tended to grow steadily from year to year in recent decades, data show that the latest 2 years of growth have been relatively slow.
The health workforce in Australia is large and diverse, covering many occupations, from highly qualified professionals to support staff and volunteers. Nurses and midwives are the largest group in the workforce: the number of full-time equivalent nurses and midwives employed is almost 3 times that of the next largest health profession, medical practitioners.
'Chapter 6 Preventing and treating ill health' provides more comprehensive coverage of health care services, including those delivered by hospitals and some specialised treatment services.
2.1 How does Australia's health system work?
Australia's health system
What do we mean by the 'health system'?
The World Health Organization says it is 'all the activities whose primary purpose is to promote, restore and/or maintain health' (WHO 2013b). A good health system is one that 'delivers quality services to all people, when and where they need them' (WHO 2013a).
While the organisation of services varies around the world, common elements include 'a robust financing mechanism; a well-trained and adequately paid workforce; reliable information on which to base decisions and policies; well-maintained facilities and logistics to deliver quality medicines and technologies' (WHO 2013a).
Australia's health system is a multifaceted web of public and private providers, settings, participants and supporting mechanisms.
In 2013–14, health spending was estimated at $155 billion, of which $145 billion was recurrent health expenditure (AIHW 2015b) (see 'Chapter 2.2 How much does Australia spend on health care?'). There are divided responsibilities for funding that involve all levels of government (federal, state and territory, and local) as well as non-government organisations, private health insurers, and individuals who pay for some services out of their own pockets.
Health services are provided by a variety of organisations and health professionals, including medical practitioners, nurses, allied and other health professionals, hospitals, clinics, pharmacies, and government and non-government agencies. Together, they deliver a wide range of services, from public health and preventive services in the community, to primary health care, emergency health services, hospital-based treatment in public and private hospitals, and rehabilitation and palliative care.
These health services are supported by many other agencies. For example: research and statistical bodies provide information for disease prevention, detection, monitoring, diagnosis, treatment, care and associated policy; consumer and advocacy groups contribute to public debate and policy development; and universities and health services (among others) contribute to the training of health professionals. Voluntary and community organisations and agencies also make important contributions, including raising money for health services and research, running educational and health promotion programs, coordinating voluntary care, and funding and delivering a range of health services.
Government responsibilities
Australia's federal, state and territory and local governments share responsibility for health and they have many roles (funders, policy developers, regulators and service deliverers) (PM&C 2014).
Private sector health service providers include private hospitals, medical practices and pharmacies.
Public hospitals are funded by the state, territory and Australian governments, and managed by state and territory governments. Private hospitals are owned and operated by the private sector but licensed and regulated by governments.
The Australian Government and state and territory governments fund and deliver a range of other services, including population health programs, community health services, health and medical research, and Aboriginal and Torres Strait Islander health services. The Australian Government has responsibility for the universal public health insurance scheme, Medicare (including subsidising medical services and providing funding for primary health networks).
Local governments, in addition to providing community-based health and home care services, have a significant role in public health and health promotion activities (for example, the provision of immunisation services; smoking cessation, nutrition awareness and weight loss programs; child and maternal health services; and promoting safety and physical activity) and may also deliver environmental health-related services (including water fluoridation, sanitation services, water and food inspection and food safety monitoring) (ALGA 2010; LGNSW 2016) (see Figure 2.1.1).
Figure 2.1.1: Main roles of government in Australia's health system
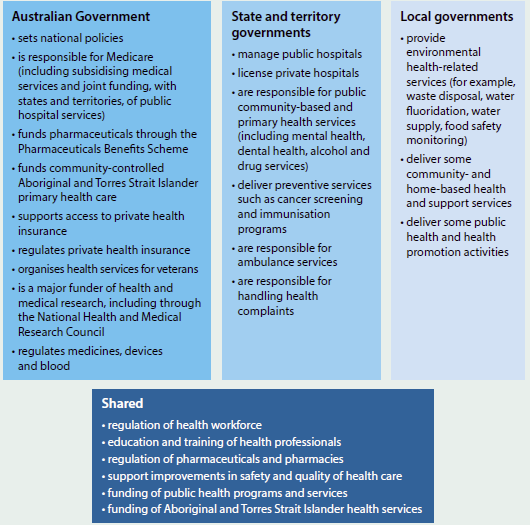
Sources: Biggs 2013; COAG 2012; Department of Health 2015b; Duckett & Willcox 2015; PM&C 2014.
Major types of health care
Primary health care
Primary health care is typically a person's first contact with the health system (Department of Health 2015f), and broadly encompasses care that is not related to a hospital visit. It includes a range of activities, such as health promotion, prevention, early intervention, treatment of acute conditions, and management of chronic conditions.
Services provided by primary health care vary, from prevention and health promotion activities (see 'Chapter 6.1 Prevention and health promotion' and 'Chapter 6.2 Cancer screening') to the treatment and management of illness.
The primary health care system can provide community-based, patient-centred care by a team of health professionals. Because of this, primary health care is often the 'best setting for the prevention and management of chronic and complex health conditions' (PHCAG 2015:5).
Primary health care is delivered in a variety of settings, including general practices, community health centres, allied health practices, and through communication technology such as telehealth and video consultations.
Primary health care services are delivered by various health professionals, including general practitioners, nurses, nurse practitioners, allied health professionals, midwives, pharmacists, dentists, and Aboriginal and Torres Strait Islander health workers.
Primary health care accounted for around 38% ($55 billion) of the $145 billion recurrent health expenditure in 2013–14, compared with around 40% ($59 billion) spent on hospital services (see 'Chapter 2.2 How much does Australia spend on health care?'). For more information on primary health care, see 'Chapter 6.3 Primary health care'.
Primary Health Networks
On 1 July 2015, the Australian Government established 31 Primary Health Networks (PHNs). (For a map of PHNs, visit the Department of Health website.)
PHNs work directly with GPs, other primary health care providers, hospitals, and the broader community. They aim to:
- increase the efficiency and effectiveness of medical services for patients, particularly those at risk of poor health outcomes
- improve coordination of care to ensure patients receive the right care in the right place at the right time (Department of Health 2015c).
The PHNs have six priorities for targeted work: mental health, Aboriginal and Torres Strait Islander health, population health, the health workforce, eHealth, and aged care (Department of Health 2015c).
Where possible, PHN boundaries align with Local Hospital Networks (LHNs) or equivalents, or clusters of LHNs. This arrangement aims to facilitate collaborative working relationships, reduce duplication of effort, and assist with the management of patients with complex or chronic conditions (Department of Health 2015c).
Secondary health services
The primary health sector does not operate in isolation. It is part of a larger system involving other services and sectors and so can be considered the 'gateway' to the wider health system. Individuals can be directed from one primary care service to another, and from primary services into secondary and other health services, and back again.
'Secondary care' is medical care provided by a specialist or facility upon referral by a primary care physician (Merriam-Webster 2015).
Hospitals
In Australia, hospital services are provided by both public and private hospitals.
In 2013–14, there were 1,359 hospitals—747 public and 612 private. Of the 9.7 million hospital admissions that year, 59% were same-day hospitalisations (AIHW 2015a) (see 'Chapter 6.8 Overview of hospitals').
Hospital emergency departments are a critical component of hospitals and of the health system. They provide care for patients who have an urgent need for medical or surgical care. In 2014–15, almost 7.4 million emergency department presentations were reported by public hospitals—just over 20,000 each day (see 'Chapter 6.11 Emergency department care'). Australian public hospitals also provided around 18 million occasions of service for outpatient care in 2013–14 (excluding Victoria, which provided 3.7 million occasions of service in 2012–13) (AIHW 2015c).
In 2013–14, spending on public hospitals accounted for 31% of total recurrent health spending—$45.7 billion (see 'Chapter 2.2 How much does Australia spend on health care?').
For more detail on private hospital spending and services, see 'Chapter 2.2 How much does Australia spend on health care?' and 'Chapter 6.8 Overview of hospitals'.
Local Hospital Networks
LHNs are independent authorities set up by the states and territories to manage public hospital services and funding. There are more than 135 LHNs in Australia and they are directly accountable for hospital performance. (For information on LHNs, visit the health department website for your state or territory.)
Although most LHNs are responsible for the provision of public hospital services in a defined geographical area, in some jurisdictions a small number of LHNs provide services across a number of areas, for example, children's hospitals.
Jurisdictions often have their own names for LHNs. For example, in New South Wales, they are known as 'Local Health Districts'; in Queensland they are known as 'Hospital and Health Services'; in South Australia they are known as 'Local Health Networks'; and in Tasmania they are known as 'Tasmanian Health Organisations'.
How the health system is funded
In 2013–14, health expenditure in Australia was estimated at $155 billion, or 9.8% of gross domestic product, compared with $150 billion in 2012–13 and nearly $95 billion in 2003–04 (adjusted for inflation) (AIHW 2015b).
Almost 68% of total health expenditure during 2013–14 was funded by governments, with the Australian Government contributing 41% and state and territory governments nearly 27%. The remaining 32% ($50 billion) was paid for by individuals through out-of-pocket expenses (18%), by private health insurers (8.3%) and through accident compensation schemes (6.1%) (AIHW 2015b) (see 'Chapter 2.2 How much does Australia spend on health care?').
The distribution of funding between government and the non-government sector varies, depending on the type of health goods and services being provided. Public hospitals are funded by the state and territory and Australian governments, but are largely owned and managed by the state and territory governments. Private hospitals are largely owned and operated by private (non-government) organisations—either for-profit companies, or not-for-profit organisations (AIHW 2015a).
The Australian Government provides a large amount of funding for medical services and subsidised medications, with the balance sourced from the non-government sector. The state and territory governments provide most of the funding for community health services. Non-government sources (such as private health insurers and individuals), as well as private hospitals, provide large portions of the funding for dental services, aids and appliances, some medications, and other health practitioner services.
Figure 2.1.2 provides a picture of the main services, funding responsibilities and providers. Health funding and the composition of the workforce are covered in detail in a separate article and snapshot in this chapter, but an overview is provided here to outline the main elements of Australia's health system.
The inner segments show the relative size of the recurrent expenditure in each of the main sectors of the health system: hospitals, primary health care, and other services. The 'hospitals' sector includes all services provided by public and private hospitals. 'Primary health care' includes a range of front-line health services delivered in the community (as described earlier), and also includes the cost of medications provided through the Pharmaceutical Benefits Scheme (PBS), as well as over-the counter and non-PBS prescription medications. The category 'other services' includes medical services other than those provided by GPs, medical research, health aids and appliances, patient transport services and health administration. It is important to note that these examples are not exhaustive, and each group of services consists of many types of activities.
The middle ring indicates the relative expenditure on the specific service types within each sector, and who delivers the service; the colour coding shows whether the service is provided by the private sector, public sector, or both. The outer ring shows the funding source for the different services and the relative size of the funding.
Medicare
The Australian Government's funding contributions include a universal public health insurance scheme, Medicare. Medicare was introduced in 1984 to provide free or subsidised access to public hospital services and to treatment by health professionals (including doctors, optometrists and some other health professionals) (DHS 2015a).
The Medicare system has three parts: hospital, medical and pharmaceutical. Coverage of pharmaceuticals predates Medicare, with the PBS introduced in 1948.
Figure 2.1.2: Health services—funding and responsibility, 2013–14
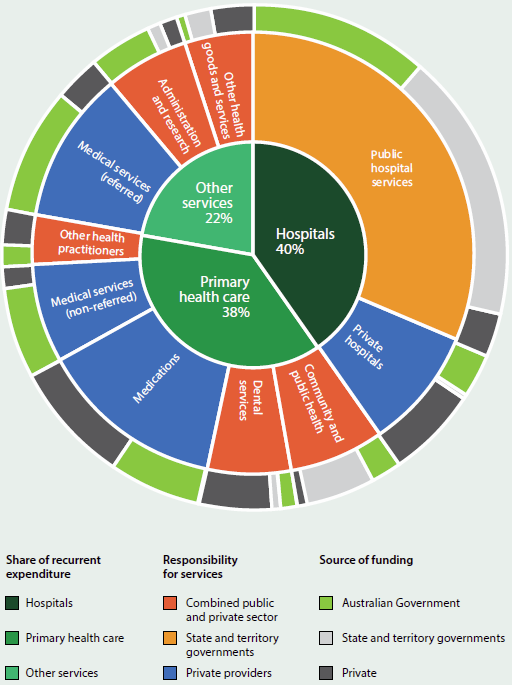
Note: The inner segments indicate the relative size of expenditure in each of the three main sectors of the health system ('Hospitals', 'Primary health care', and 'Other services'). The middle ring indicates both the relative expenditure on each service in the sector (shown by the size of each segment) and who is responsible for delivering the service (shown by the colour code). The outer ring indicates both the relative size of the funding (shown by the size of each segment) and the funding source for the difference services (shown by the colour code). For more detail, refer to the main text.
Medicare is funded by taxpayers who, in addition to general income tax, pay a levy of 2.0% of their taxable income and a further surcharge of 1.0–1.5% of an individual taxpayer's income for a single taxpayer earning above $90,000 and for families earning over $180,000 who choose not to take out a specified level of private hospital cover (ATO 2015).
Medicare benefits are not available for medical treatment a person receives overseas. However, the Australian Government has signed Reciprocal Health Care Agreements to help cover the cost of essential medical treatment for Australians visiting certain countries: New Zealand, the United Kingdom, the Republic of Ireland, Sweden, the Netherlands, Finland, Italy, Belgium, Malta, Slovenia and Norway (DHS 2014).
Medicare and hospital treatment
Medicare offers fee-free treatment as a public patient in a public hospital, by a doctor appointed by the hospital (DHS 2015a).
It also covers 75% of the Medicare Benefits Schedule (MBS) fee for services and procedures for private patients in a public or private hospital (DHS 2015a).
Medicare and medical services
MBS fees are set by the Australian Government. Medical practitioners are not required to adhere to the recommended schedule and can charge more than the scheduled fee for private patients. If the practitioner charges more than this fee, the patient is required to pay the extra amount, which is known as a 'gap' payment.
When a person visits a doctor outside a hospital, Medicare will reimburse 100% of the MBS fee for a GP and 85% of the MBS fee for a specialist. If the doctor bills Medicare directly (bulk billing), the patient will not have to pay anything (DHS 2015b). If the doctor charges more than the MBS fee, the patient has to pay the gap.
Medical costs not usually covered by Medicare include:
- ambulance services
- most dental examinations and treatment
- most physiotherapy and other allied health services
- glasses and contact lenses.
In 2014–15, 21 million Australians (90% of the population) accessed more than 368 million individual services on the MBS—more than 1 million services a day (Department of Health 2015a).
Pharmaceutical Benefits Scheme
The Australian Government subsidises a wide range of prescription pharmaceuticals under the PBS. Under the PBS, the amount paid by the patient varies, up to a maximum of $38.30 for general patients and $6.20 for those with a concession card (Department of Health 2015e).
There are two safety net thresholds that operate on a calendar year. The general patient threshold is about $1,475. When a person and/or their family's co-payments reach this amount, they may then pay the concessional rate for prescriptions. The concessional safety net threshold is $372. When a patient and/or their family's total co-payments reach this amount, they may get their subsequent medications for free for the rest of the calendar year (Department of Health 2015e).
If a medicine is not listed on the PBS schedule, the consumer has to pay the full price as a private prescription (Department of Health 2015d). In some cases, these costs may be reimbursed by private insurance funds. Pharmaceuticals provided in public hospitals are generally provided to public patients for free, with the cost covered as part of the hospital treatment. Public hospitals are allowed to prescribe pharmaceuticals under the PBS to certain patients and in this situation the same co-payments apply as for pharmaceuticals prescribed in the community.
Repatriation Pharmaceutical Benefits Scheme
The Repatriation Pharmaceutical Benefits Scheme provides access to a range of pharmaceuticals and dressings at a concessional rate for the treatment of eligible war veterans, war widows/widowers and their dependants (DVA 2012).
Private health insurance
Private health insurance is available for those who wish to fully or partly cover the costs of being admitted to hospital as a private patient and/or the costs of other ancillary health services (Private Healthcare Australia 2015).
At June 2015, 11.3 million Australians (47% of the population) had some form of private patient hospital cover, and 13.3 million (56%) had some form of general treatment cover (APRA 2015).
Part of the cost of a hospital admission as a private patient is also covered by the Australian Government through Medicare.
A person can choose to be treated as a public patient in a public hospital, even if they have private health insurance. Private health insurance is not compulsory, and people can mix and match the levels and type of cover to suit their individual circumstances. The Australian Government offers a means-tested rebate for people with private health insurance.
Who governs health services?
Overall coordination of the public health care system is the responsibility of the Australian Government and state and territory government health ministers. Managing the individual national and state and territory health systems is the responsibility of the relevant health minister and health department in each jurisdiction.
The health ministers are collectively referred to as the Health Council, which comes under the auspices of the Council of Australian Governments—the peak intergovernmental forum in Australia. Membership of the Health Council also includes the Australian Government Minister for Veterans' Affairs and the New Zealand Health Minister (COAG Health Council 2014b).
The Health Council's responsibility is to 'provide a forum for cooperation on health issues, especially primary and secondary care, and consider increasing cost pressures' (COAG Health Council 2014c).
The Health Council is supported by the Australian Health Ministers' Advisory Council, which comprises the heads of the Australian Government health department, all state and territory health departments, the New Zealand health department, and the Australian Government veterans' affairs department (COAG Health Council 2014a).
Regulation
Health regulation is a government responsibility. The Australian Government's regulatory roles include overseeing the safety and quality of pharmaceutical and therapeutic goods and appliances, while the state and territory governments license or register private hospitals, and have legislation for the operation of public hospitals.
The licensing of pharmacy premises and pharmacy ownership restrictions is also the responsibility of the states and territories. State and territory governments are also largely responsible for health-related industry regulations, such as for the sale and supply of alcohol and tobacco products.
Both levels of government jointly regulate some areas, including food standards, safety and quality of health care, and the health workforce.
Registration of health professionals
A National Registration and Accreditation Scheme for health practitioners started on 1 July 2010. Fourteen professions have joined the scheme, including medical practitioners, nurses and midwives, pharmacists and other allied health professions (AHPRA 2015a) (see 'Chapter 2.3 Who is in the health workforce?').
Each profession in the scheme is represented by a National Board that is responsible for registering practitioners and students, and for setting the standards that all registered health professionals must meet (AHPRA 2015b).
The scheme is implemented by national boards, which are supported by an independent body, the Australian Health Practitioner Regulation Agency.
One of the objectives of the scheme is to protect the public by ensuring that only health practitioners who are suitably trained and qualified are registered (AHPRA 2015a).
In 2015, health ministers approved a National Code of Conduct for the non-registered health care workers, currently operating in New South Wales, Queensland, and South Australia. Once implemented in each state and territory, the code will provide protection for the public by setting minimum standards expected of anyone who delivers a health service; and will also provide national prohibition orders.
For some health practitioner disciplines not regulated under the National Registration and Accreditation Scheme (such as dietitians, naturopaths, massage therapists and optical technicians), professional associations provide guidance on professional standards, with some associations having a formal credentialing or accreditation process that sets benchmarks for expected practice for individual practitioners.
How does Australia's health system compare internationally?
The results presented here show how Australia compares with members of the Organisation for Economic Co-operation and Development (OECD), an international organisation of 34 countries. The rankings are based on analysis that uses OECD methodology.
(For information on how Australia ranks internationally on selected health indicators, see 'Chapter 1.3 How healthy are Australians?').
Health expenditure
Using OECD calculations methods, in 2013, Australia's spending on health as a proportion of GDP was 9.4%, slightly higher than the OECD average of 9.3%. This ranked Australia in the middle (10th) of the 22 OECD countries with available data. The United States was by far the biggest spender on health care, at 17.1% of GDP (AIHW 2015b) (see also 'Chapter 2.2 How much does Australia spend on health care?').
Australia's health expenditure per person ($5,060) was higher than the OECD average ($4,561); 9th out of 22 countries. Again, the United States was the biggest spender, at $10,963 per person (AIHW 2015b). (Note: spending has been converted to Australian dollars using GDP purchasing-power parities.)
Health care resources
A substantial increase has occurred in the medical workforce in Australia since 2000 that coincided with a rise in the number of medical graduates. In 2013, Australia had 3.4 practising physicians per 1,000 population, up from 2.5 in 2000, which was slightly above the OECD average (3.3) (OECD 2015b).
Australia had 11.5 nurses per 1,000 population, up from 10.1 in 2000, which was above the OECD average (9.1) and 3.7 hospital beds per 1,000 population, down from 4.0 in 2000, and lower than the OECD average of 4.8 (OECD 2015b).
Challenges for the health system
The health system faces a number of challenges. An ageing population, increases in consumer expectations, more expensive technologies, and a growing burden of chronic conditions are among the factors driving an increased demand for services and rising health expenditure (PM&C 2014).
In a recent report, the OECD noted that this 'health shift' of ageing populations and people living longer with multiple chronic and disabling conditions had 'important implications for how care is best organised and provided; where new treatment innovations can be expected; and future cost pressures on governments' (OECD 2015a:20).
The complexity of Australia's health system also presents challenges, particularly for people with complex health conditions who may be under the care of multiple health professionals and who move from one health service to another with little or no continuity of care (PHCAG 2015; PM&C 2014).
In 2015, the Australian Government established a Primary Health Care Advisory Group to investigate possible reforms to primary health care to improve the management of people with complex and chronic disease (Department of Health 2015g).
The group noted that patients often experienced 'a fragmented system, with providers and services working in isolation'; uncoordinated care; difficulty finding services they needed; duplication of services; and 'feelings of disempowerment, frustration and disengagement' (PHCAG 2015:5).
The health sector also has strong connections to the welfare sector, which may also make integration of care, and funding responsibility, difficult (see Box 2.1.1).
Box 2.1.1: The interface between health and welfare services
The health sector is a complex interaction of public and private service providers, settings, participants and supporting mechanisms. Many people will have experienced this complexity first hand as they have attempted to navigate the system for themselves or for someone for whom they are caring.
But the complexity doesn't end there—particularly for more vulnerable groups, such as older people, people with disability or the homeless. Not only do people need to navigate specific and separate service sectors (such as aged care), they also need to negotiate the interface between these sectors and the health sector. In many instances this is not a single transition, as they dip in and out of sectors and services as the need arises.
An example is people in residential aged care who may need treatment in a hospital. The AIHW report Movement between hospital and residential aged care 2008–09 (AIHW 2013) showed that, of the 1.1 million hospitalisations of people aged 65 and over, 9% of the admissions were from residential aged care, and 11% of the discharges were to residential aged care—about 200,000 total movements between the hospital sector and the residential aged care sector.
The health-welfare interface has been brought into sharper relief over the course of this decade because of major national reforms in hospital services, primary care, aged care and disability support (the latter through the introduction of the National Disability Insurance Scheme). Associated with many of these reforms have been changes in the relative responsibilities in policy, program and funding between the Australian Government and state and territory governments.
Hence it is critical that robust policies, information systems and monitoring programs are in place—and are further developed—so that all Australians, and particularly those with special and complex needs, can benefit from an integrated, responsive, efficient, effective, safe health and welfare services system.
What is missing from the picture?
Currently it is not easy to profile how a person interacts with the health system—that is, the different services they use, the treatment and care provided, and the health outcome. Initiatives such as eHealth and the creation of an integrated records system for each person may provide some of this information in the future. Such information could also provide insights into the overall effectiveness and efficiency of the health system, and help prevent duplication of testing and procedures.
Where do I go for more information?
Individual aspects of the health system are discussed in more detail throughout this report.
Detailed information on health spending and the health workforce is available at Expenditure and Workforce respectively.
Detailed information on Australian hospitals is available at Hospitals.
More information on health reform, health practitioner registration and Australian Government health policies is available from the Department of Health website.
More information on intergovernmental arrangements and agreements is available at the COAG website.
References
AHPRA (Australian Health Practitioner Regulation Agency) 2015a. About the National Scheme. Canberra: AHPRA. Viewed 24 November 2015.
AHPRA 2015b. Who we are. AHPRA: Canberra. Viewed 24 November 2015.
AIHW (Australian Institute of Health and Welfare) 2013. AIHW 2013. Movement between hospital and residential aged care 2008–09. Data linkage series 16. Cat. no. CSI 16. Canberra: AIHW.
AIHW 2015a. Australia's hospitals 2013–14: at a glance. Health services series no. 61. Cat. no. HSE 157. Canberra: AIHW.
AIHW 2015b. Health expenditure Australia 2013–14. Health and welfare expenditure series no. 54. Cat. no. HWE 63. Canberra: AIHW.
AIHW 2015c. Non-admitted patient care 2013–14: Australian hospital statistics. Health services series no. 62. Cat. no. HSE 159. Canberra: AIHW.
ALGA (Australian Local Government Association) 2010. Health and wellbeing. Canberra: ALGA. Viewed 12 January 2016.
APRA (Australian Prudential Regulation Authority) 2015. Statistics: private health insurance membership and coverage June 2015. Sydney: APRA.
ATO (Australian Taxation Office) 2015. Medicare levy. Canberra: ATO. Viewed 30 September 2015.
Biggs A 2013. Health in Australia: a quick guide. Canberra: Commonwealth of Australia. Viewed 30 September 2015.
COAG (Council of Australian Governments) 2012. National Healthcare Agreement 2012. Canberra: COAG.
COAG Health Council 2014a. AHMAC membership. Adelaide: COAG Health Council. Viewed 2 October 2015.
COAG Health Council 2014b. CHC membership. Adelaide: COAG Health Council. Viewed 2 October 2015.
COAG Health Council 2014c. CHC priorities. Adelaide: COAG Health Council. Viewed 2 October 2015.
Department of Health 2015a. Annual Medicare statistics. Canberra: Department of Health. Viewed 24 November 2015.
Department of Health 2015b. Australia's health system—an overview. Canberra: Department of Health. Viewed 30 September 2015.
Department of Health 2015c. Frequently asked questions on the establishment of Primary Health Networks. Canberra: Department of Health. Viewed 29 September 2015.
Department of Health 2015d. How much am I charged for non-PBS items? Canberra: Department of Health. Viewed 30 September 2015.
Department of Health 2015e. Patient charges. Canberra: Department of Health. Viewed 30 September 2015.
Department of Health 2015f. Primary care. Canberra: Department of Health. Viewed 12 January 2016.
Department of Health 2015g. Primary Health Care Advisory Group (PHCAG). Canberra: Department of Health. Viewed 10 February 2016.
DHS (Department of Human Services) 2014. Reciprocal health care agreements. Canberra: Department of Human Services. Viewed 30 September 2015.
DHS 2015a. About Medicare. Canberra: Department of Human Services. Viewed Canberra 2015.
DHS 2015b. Medicare bulk billing. Canberra: DHS. Viewed 5 January 2016.
Duckett S & Willcox S 2015. The Australian health care system. 5th edition. South Melbourne: Oxford University Press.
DVA (Department of Veterans' Affairs) 2012. Funding for pharmaceuticals and health services in the home. Canberra: Department of Veterans' Affairs. Viewed 30 September 2015.
LGNSW (Local Government NSW) 2016. Health. Sydney: LGNSW. Viewed 12 January 2016.
Merriam-Webster 2015. Medical dictionary. Springfield, Massachusetts: Merriam Webster Incorporated. Viewed 25 January 2016.
OECD (Organisation for Economic Co-operation and Development) 2015a. Health data governance: privacy, monitoring and research. Paris: OECD.
OECD 2015b. OECD health statistics 2015. Paris: OECD. Viewed 12 October 2015.
PHCAG (Primary Health Care Advisory Group) 2015. Better outcomes for people with chronic and complex health conditions through primary health care: discussion paper. August 2015. Canberra: Primary Health Care Advisory Group. Viewed 23 December 2015.
PM&C (Department of the Prime Minister and Cabinet) 2014. Reform of the Federation White Paper. Issues paper 3—roles and responsibilities in health. 11 December 2014. Canberra: PM&C.
Private Healthcare Australia 2015. Benefits for you. Canberra: Private Healthcare Australia. Viewed 30 September 2015.
WHO (World Health Organization) 2013a. Health systems. Geneva: WHO. Viewed 28 November 2013.
WHO 2013b. Health systems strengthening glossary. Geneva: WHO. Viewed 24 September 2015.
2.2 How much does Australia spend on health care?
Health expenditure is money spent on health goods and services. It includes money spent by governments as well as by individuals and other non-government funders, such as private health insurers. The providers of health goods and services include hospitals, primary health care providers such as general practitioners (GPs), and other health professionals.
Over recent decades, health expenditure has grown relatively steadily from year to year. Over the decade from 2003–04 to 2013–14, health expenditure grew faster in real terms than overall gross domestic product (GDP), with an average annual real growth of 5.0%—2.2 percentage points higher than the 2.8% growth in GDP.
Using Organisation for Economic Co-operation and Development (OECD) methods, the ratio of Australia's health expenditure to GDP was 9.4% in 2013, near to the average for OECD countries (9.3%). It is a higher proportion than that of the United Kingdom (8.8%) and a lower proportion than in Canada (10.7%) and New Zealand (11.0%). The United States was by far the highest spender, with the health sector making up 17.1% of GDP in 2013.
Total expenditure on health (that is, recurrent and capital expenditure combined) has grown each year, in real terms (after adjusting for inflation) from $95 billion in 2003–04 to an estimated $155 billion in 2013–14 (see Figure 2.2.1).
Figure 2.2.1: Total health expenditure 2004–05 to 2013–14, adjusted for inflation
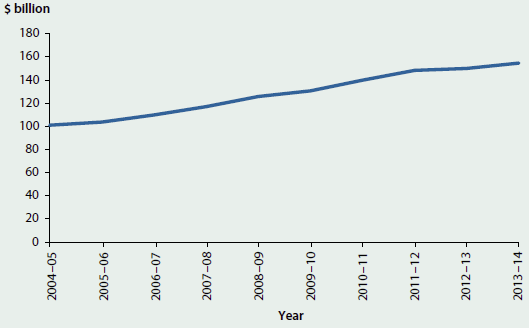
Note: Inflation-adjusted prices expressed in terms of 2013–14 prices.
Source: AIHW health expenditure database.
Where is the money spent?
Of the $155 billion spent in 2013–14, $145 billion was recurrent health expenditure. In 2013–14, $59 billion was spent on Hospitals in Australia, increasing in real terms from $37 billion in 2003–04 (Figure 2.2.2). The share of recurrent expenditure accounted for by Hospitals remained relatively constant over the decade, at around 40%.
Primary health care expenditure was $55 billion in 2013–14, around 38% of recurrent expenditure. This was an increase, adjusted for inflation, from $34 billion in 2003–04. In 2012–13 and 2013–14, Unreferred medical services (largely GP services) attracted the highest share of Primary health care expenditure, at 19.1% and 19.3% respectively. Unreferred medical services cost $10.6 billion in 2013–14, with $8.7 billion funded by the Australian Government. Expenditure on pharmaceuticals through the Pharmaceutical Benefits Scheme (PBS) and Repatriation Pharmaceutical Benefits Scheme (RPBS), referred to as Benefit-paid pharmaceuticals, and included in the Primary health care group, was $10.1 billion in 2013–14.
In 2013–14, $32 billion was spent on Other health goods and services, an increase in real terms from $19 billion in 2003–04. The share of recurrent expenditure accounted for by Other health goods and services was around 22% in 2013–14. Around 50% of Other health goods and services expenditure was for Referred medical services (largely specialist medical services), with an expenditure of $16 billion in 2013–14.
Capital expenditure increased in real terms from $4.3 billion in 2003–04 to $9.1 billion in 2013–14.
Figure 2.2.2: Total health expenditure, by broad area of expenditure, adjusted for inflation, 2003–04 to 2013–14
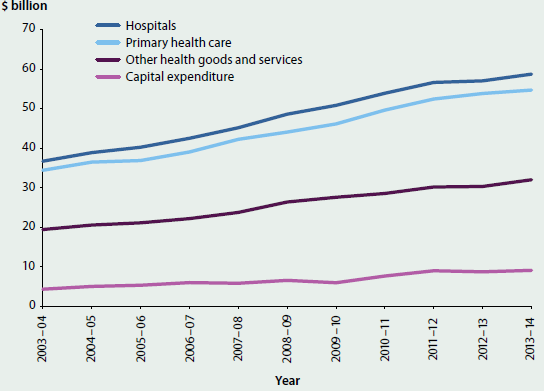
Note: Inflation-adjusted prices expressed in terms of 2013–14 prices.
Source: AIHW health expenditure database.
Who pays for what?
In 2013–14, governments were responsible for $105 billion, or nearly 68% of total health expenditure of $155 billion in Australia. Of the government contribution, the Australian Government contributed $63.5 billion, or 41% of total health expenditure, and state and territory governments contributed $41 billion, or nearly 27% of total health expenditure.
The Australian Government provides a large amount of the funding for medical services—$21 billion in 2013–14, or 78% of medical services expenditure—with the balance sourced from the non-government sector. The Australian Government also spent $8.4 billion for benefit-paid medications, covering 84% of benefit paid medication expenditure in 2013–14.
State and territory governments on the other hand provide most of the funding for community health services, contributing $6.2 billion in 2013–14, or 79% of community health service expenditure.
Most funding provision for public hospital services is shared between Australian, state and territory governments. The Australian Government provided 37% of recurrent funding for public hospital services in 2013–14 ($17 billion), while the state and territory governments, which have primary responsibility for operating and regulating public hospitals, provided 54% ($25 billion).
Total non-government expenditure was nearly $50 billion in 2013–14, or 32% of the share of total health expenditure. Funding by individuals was $27.5 billion in 2013–14, which accounted for nearly 55% of estimated non-government funding and nearly 18% of total health expenditure. Nearly 93% of funding for non-subsidised medicines ($9.0 billion) in 2013–14—such as over-the counter medications, private prescriptions and under co-payment level medicines—was funded by individuals. Nearly 60% of dental services expenditure in 2013–14 was funded by individuals ($5.3 billion).
Private health insurance funds provided $13 billion of total health expenditure in 2013–14, while the balance of $9.4 billion came from other non-government sources, mainly in the form of payments by compulsory motor vehicle third-party and workers' compensation insurers.
The majority of private health insurance funding was for hospital services, with $7.3 billion spent in 2013–14.
For further information on the Australian health system, including an overview of health expenditure, see 'Chapter 2.1 How does Australia's health system work?'.
Changes in expenditure over recent years
Average annual growth in health expenditure over the past decade was 5.0%, but the rate slowed in recent years. In real terms the rate from 2011–12 to 2012–13 was 1.1%, and 3.1% from 2012–13 to 2013–14.
Since Australia's Health 2014 was released, growth in the government contribution to health expenditure also slowed and in some areas expenditure declined. The 68% of total spending sourced from governments in 2013–14 was lower than in 2011–12, when governments funded nearly 70% of total health expenditure. The areas of expenditure that most affected the slowdown in growth included Public health, Benefit-paid pharmaceuticals, Administration and Patient transport expenditure.
In real terms, adjusted for inflation, funding by the Australian Government decreased by 2.5% between 2011–12 and 2012–13. It then increased by 2.4% between 2012–13 and 2013–14. This was lower than average annual growth over the decade (4.4%) and, for the 2 years combined, there was a real decrease of 0.1% from 2011–12 to 2013–14. The main drivers of the decrease in Australian Government expenditure from 2011–12 to 2012–13 were changes to the PBS, to private health insurance premium rebates, and to the medical expenses tax rebate.
PBS expenditure followed a similar pattern to overall Australian Government expenditure, with a decline of 2.1% between 2011–12 and 2012–13 followed by a relatively small increase the following year of 1.7% (Department of Health 2015). This followed the introduction of a generic medicines initiative, which affects the negotiated price of listed pharmaceuticals through the listing of off-patent generic drugs, as well as price disclosure changes (Department of Health 2010). This decrease in expenditure did not necessarily mean fewer services provided. The number of subsidised prescriptions dispensed over this time increased from 208 million in 2011–12 to 223 million in 2013–14.
Changes to the private health insurance rebate income testing arrangements reduced the share of funding provided by the Australian Government through the rebate scheme. Coinciding with this, the proportion of expenditure funded by private health insurers increased from 7.4% in 2011–12 to 8.3% in 2013–14.
From July 2012, the medical expenses tax rebate became income tested. Expenditure on the medical expenses tax rebate declined in real terms, from $574 million in 2011–12 to $226 million in 2013–14.
In 2012–13 and 2013–14, growth in state and territory government spending, another major source of health expenditure funding, was also relatively slow. The state and territory government share of total health expenditure declined from 26.9% in 2011–12 to 26.6% in 2013–14.
The two fastest growing areas of expenditure between 2011–12 and 2013–14 were All other medications (private prescriptions, over-the-counter prescriptions and under co-payment pharmaceuticals) and Aids and appliances. The share of total health expenditure that related to All other medications increased from 5.9% in 2011–12 to 6.3% in 2013–14, with a cost of $9.7 billion in 2013–14. The share of total health expenditure relating to Aids and appliances increased from 2.4% in 2011–12 to 2.6% in 2013–14 ($4.0 billion in 2013–14).
Non-government recurrent expenditure grew in real terms, from $41 billion in 2011–12 to nearly $46 billion in 2013–14, and the share of total expenditure rose from 30% to 32%.
Expenditure for admitted patients
To better understand the drivers of the expenditure trends outlined above, the AIHW periodically conducts additional studies into the purposes for the expenditure and the characteristics of the people for whom the expenditure is incurred, in terms of the diseases or conditions managed, their age, sex and Indigenous status.
The AIHW has analysed admitted patient care expenditure, for both public and private hospitals, for the years 2004–05 to 2012–13. Expenditure on admitted patient services represents around 70% of total hospital expenditure, with the remainder being for emergency departments and non-admitted care.
For each hospital stay (referred to as a hospital 'separation' or 'hospitalisation'), expenditure was allocated to the diagnoses that were likely to have influenced the cost, including diseases or conditions that the patient had on admission to hospital, and any arising after admission.
These data may be affected by different admission and data recording practices over time. The data do, however, provide significant insight into the key trends in expenditure for admitted patients over the period. A broad overview of these trends is provided in the following sections.
To assist with comparisons with the analysis presented in Chapter 3.1 'Burden of disease and injury in Australia', the data have been presented in terms of burden of disease or condition groups.
What disease or condition groups were responsible for the most expenditure for admitted patients?
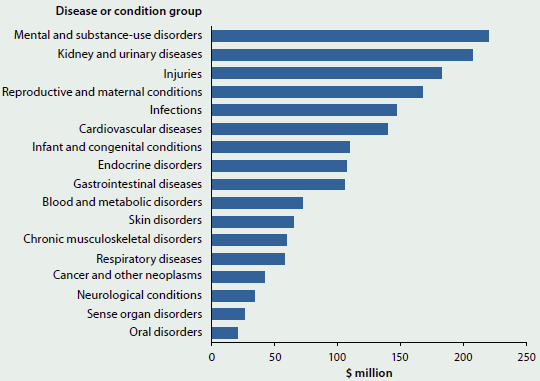
The Cardiovascular diseases group was responsible for the most expenditure in the years 2004–05, 2008–09 and 2012–13 (see Figure 2.2.3). In 2012–13, around $5 billion of total admitted patient expenditure (11.1%) was related to Cardiovascular diseases.
Figure 2.2.3: Disease or condition group expenditure, 2004–05, 2008–09 and 2012–13, adjusted for inflation
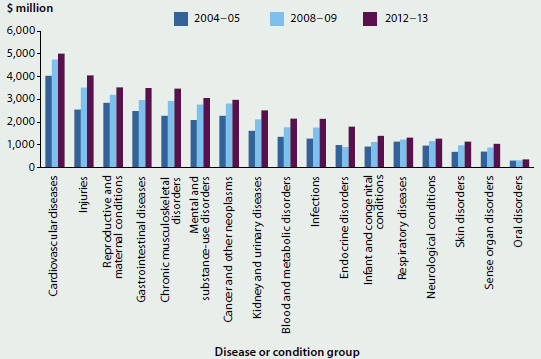
Notes
- Inflation adjusted prices expressed in terms of 2012–13 prices.
- There was a large growth in expenditure on the Endocrine disease group, which includes diabetes, from 2008–09 to 2012–13. Changes to the Australian Coding Standard for Diabetes mellitus and intermediate hyperglycaemia (formerly Diabetes mellitus and impaired glucose regulation) on 1 July 2012 have affected the comparability, over time, of data reported for diabetes.
Source: AIHW disease expenditure database.
Other high-expenditure disease or condition groups included Injuries, Reproductive and maternal conditions and Gastrointestinal diseases. The Reproductive and maternal conditions group includes costs associated with healthy newborns as well as costs associated with the mother.
Age and sex differences in expenditure
Cardiovascular diseases was a high-expenditure group for both men and women but the expenditure for men is higher, with $2.9 billion of admitted patient expenditure spent on men in 2012–13 and $2.1 billion on women (Figure 2.2.4). Other disease or condition groups that had higher expenditure for men were Injuries (with 55% of expenditure for men), Mental and substance-use disorders (55%), Kidney and urinary diseases (55%), Endocrine disorders (54%), Infections (53%) and Cancer and other neoplasms (52%).
As would be expected, admitted patient expenditure for Reproductive and maternal conditions had the highest proportion of expenditure allocated to women, at 96%, and was the group with the highest expenditure for women, with $3.4 billion spent for admitted patient care in 2012–13. Other high-expenditure groups where there was a higher proportion of expenditure allocated to women were Chronic musculoskeletal disorders (53%) and Blood and metabolic disorders, such as anaemia (52%).
Figure 2.2.4: Disease or condition group expenditure, by sex, 2012–13
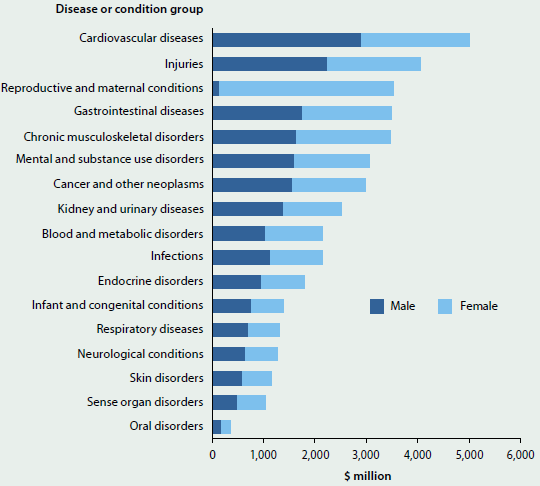
Source: AIHW disease expenditure database.
The pattern of expenditure by age group is different for males and females. For males in 2012–13, the expenditure increased from the 10–14 age group and reached a peak in the 65–69 age group ($1,979 million). Expenditure was lower for age groups older than 65–69, with the lowest amounts for those aged 95 and over.
In 2012–13, the point of highest expenditure for women occurred in an older age group than for men. The highest expenditure was in the 80–84 age group, with expenditure of $1,620 million. The 25–39 age group also had relatively high expenditure, due to expenditure in the Reproductive and maternal conditions group.
Figure 2.2.5 shows how the admitted patient expenditure by age group changed between 2004–05 and 2012–13. This change was most prominent in the 50 and older age groups, and for children aged under 1, where there was much greater expenditure in 2012–13 compared with 2004–05 (See 'Chapter 6.9 Changes in the provision of hospital care' for further information on trends in hospital care for older people).
Figure 2.2.5: Admitted patient expenditure, by age, 2004–05 and 2012–13, adjusted for inflation
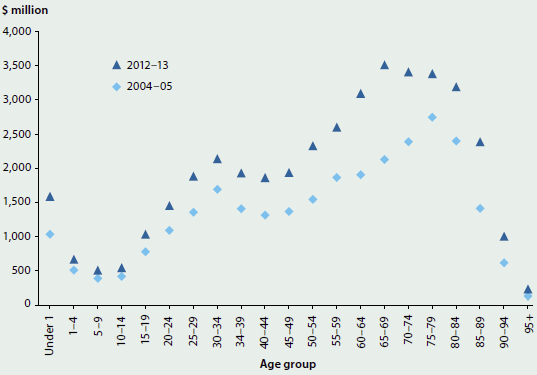
Notes
- Inflation-adjusted prices expressed in terms of 2012–13 prices.
- The 'Under 1' age group does not include healthy newborns, whose cost is included in the cost for the mother.
Source: AIHW disease expenditure database.
Expenditure per person
Admitted patient expenditure per person was higher in 2012–13 than in 2004–05 in all age groups, for both men and women, with relatively large increases in the older age groups (Figure 2.2.6). The increase in expenditure in the older age groups was, therefore, related both to there being more spent per person as well as there being more people in each age group. (For further information on older Australians, see 'Chapter 6.17 Health care use by older Australians'.) This was true of the under 1 age group as well.
Figure 2.2.6: Admitted patient expenditure per person, by age group, 2004−05 and 2012−13, adjusted for inflation
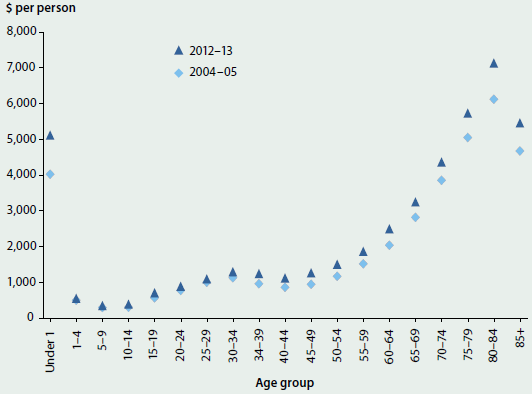
Notes
- Inflation-adjusted prices expressed in terms of 2012–13 prices.
- The 'Under 1' age group does not include healthy newborns, whose cost is included in the cost for the mother.
Source: AIHW disease expenditure database.
Expenditure for Indigenous Australians
Indigenous Australians have an expenditure profile that is different from that of non-Indigenous Australians. Mental and substance-use disorders and Kidney and urinary diseases were the disease or condition groups with the highest expenditure, both with an expenditure of over $200 million in 2012–13 (see Figure 2.2.7). These disease or condition groups were ranked as the 7th and 8th highest groups, respectively, for non-Indigenous Australians.
The Infections group ranked higher for Indigenous than for non-Indigenous Australians, but the Chronic musculoskeletal disorders and Gastro-intestinal diseases groups ranked higher for non-Indigenous than for Indigenous Australians.
Cancer and other neoplasms was one of the lowest expenditure groups for Indigenous people, but ranked 6th highest for non-Indigenous Australians. For further information on Indigenous Australians, see 'Chapter 5.7 How healthy are Indigenous Australians?'.
Figure 2.2.7: Disease or condition group expenditure for Indigenous Australians, 2012−13
Source: AIHW disease expenditure database.
What is the AIHW doing?
This detailed information on admitted patient expenditure has resulted from a redevelopment of the AIHW's health expenditure data infrastructure, which is ongoing. This work will enable the AIHW to release more detailed information on expenditure by disease, age, sex, Indigenous status and location, as well as opening these data up to researchers and policymakers more broadly.
What is missing from the picture?
Health expenditure data do not include health data from local authorities. If local government authorities received funding for health care from a state or territory government, this expenditure was included in that jurisdiction's expenditure. Data for programs self-funded by local governments (such as public health initiatives funded and run by local authorities or councils) were not collected for inclusion in the AIHW health expenditure database. Health-related costs from the Australian Defence Force or from correctional and detention facilities are also not included in the health expenditure database collection. Not all expenditure by non-government organisations is included, such as initiatives run from private donations to the organisations.
The analysis of expenditure by disease, age, sex and Indigenous status only focuses on admitted patient expenditure data. Expenditure in non-admitted, primary care or other areas has not been included.
Where do I go for more information?
More information on health expenditure is available. The report Health expenditure Australia 2013–14 and other recent publications are available for free download.
References
Department of Health 2010. Agreements ensure sustainable access to medicines. Viewed 28 January 2016.
Department of Health 2015. Expenditure and prescriptions. Viewed 28 January 2016.
2.3 Who is in the health workforce?
The health workforce in Australia is large and diverse, covering many occupations, and ranging from highly qualified professionals to support staff and volunteers. Health workforce occupations comprise workers who diagnose and treat physical and mental illnesses and conditions, or recommend, administer and dispense medications and treatment to promote or restore good health.
Many health practitioners must register through the National Registration and Accreditation Scheme (NRAS) to work in the health system. The information presented here focuses on this registered workforce, which includes medical practitioners, nurses and midwives and other health professionals such as dentists, physiotherapists and psychologists.
Nurses and midwives are the largest group in the registered health workforce, with about 353,000 registered and almost 301,000 nurses and midwives employed in 2014 (Table 2.3.1). The number of full-time equivalent (FTE) nurses and midwives employed for every 100,000 people is almost 3 times that of the next largest health profession, medical practitioners (Figure 2.3.1). In 2014, there were 1,134 full-time equivalent nurses and midwives (or 1 in 88 people was an employed nurse or midwife), 387 medical practitioners and 508 other health professionals employed for every 100,000 people.
More female health practitioners are entering the workforce. For example, in 2014, over 53% of medical practitioners in the youngest age group (20 to 34 years) were women. Women made up half (50.4%) of all specialists-in-training in 2014, which was far greater than 28.7% of women who were practising specialists in 2014.
| Workforce | Two largest professions Nurses and midwives |
Two largest professions Medical practitioners(a) |
Two selected professions Dentists |
Two selected professions Optometrists |
|---|---|---|---|---|
| Employed | 300,979 employed in 2014, up 5.0% from 286,706 in 2011 | 85,510 employed in 2014, up 7.4% from 79,653 in 2012 | 13,979 employed in 2014, up 11.0% from 12,599 in 2011 | 4,337 employed in 2014, up 7.5% from 4,034 in 2011 |
| FTE per 100,000 people | 1,134 in 2014, up 2.4% from 1,107 in 2011 | 387 in 2014, up 3.6% from 374 in 2012 | 56 in 2014, about the same as in 2011—55 | 17.4 in 2014, about the same as in 2011—17.1 |
| Percentage of women | 89% in 2014, about the same as in 2011—90% | 39% in 2014, about the same as in 2012—38% | 39% in 2014, up from 35% in 2011 | 50% in 2014, up from 46% in 2011 |
| Area | Full-time equivalent per 100,000 people in 2014 | Full-time equivalent per 100,000 people in 2014 | Full-time equivalent per 100,000 people in 2014 | Full-time equivalent per 100,000 people in 2014 |
|---|---|---|---|---|
 Major cities |
1,145 | 437 | 63 | 19 |
 Inner regional areas |
1,096 | 292 | 43 | 15 |
 Outer regional areas |
1,077 | 272 | 38 | 12 |
 Remote areas |
1,239 | 264 | 25 | 8 |
 Very remote areas |
1,233 | 264 | 25 | 8 |
- Comparison is based on 2012 data due to the inclusion of provisional registrants prior to that year.
Figure 2.3.1: Total number of employed registered health practitioners, 2014
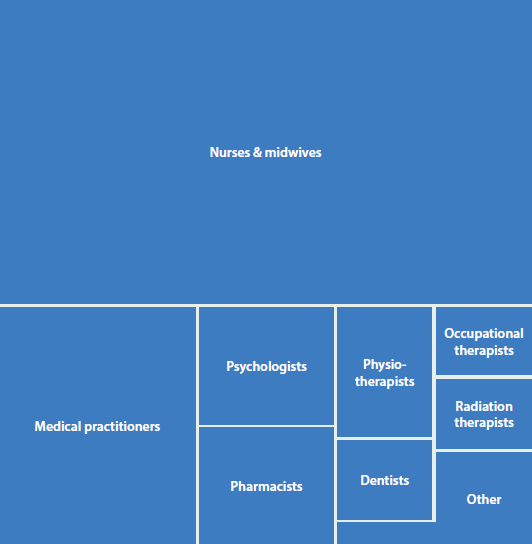
Note: 'Other' includes Optometrists, Chiropractors, Podiatrists, Chinese medicine practitioners, Osteopaths, Dental hygienists, Dental practitioners, Oral health therapists, Dental therapists, Aboriginal and Torres Strait islander health practitioners.
Source: AIHW National Health Workforce Data Set 2014.
What is missing from the picture?
The information on health practitioners who register through the NRAS through the mandatory national registration process does not include all health professionals. There are several categories of health professions, such as dieticians, sonographers and speech therapists, that are not required to register with NRAS and for whom limited data are available.
Where do I go for more information?
More information on the health workforce is available.